 Nvidia, up 238% YTD, has benefitted from a surge in demand for its general-purpose “one-size-fits-all” AI chips this year but that is shifting to customer AI applications that require custom AI chips which are designed with the use of Electronic Design Automation (EDA) software. Let’s delve into what EDA software is, its projected market growth, and the companies that are likely to benefit from this industry evolution.What is EDA Software?EDA software is the planning software for the chips industry because it ensures that designs function properly and meet performance standards.EDA Software Market GrowthThe EDA software market is primed for a huge boom as big tech firms move away from Nvidia’s general-purpose “one-size-fits-all” AI chips and increasingly use EDA software to make their own highly complex AI chips. This market is expected to sustain double-digit growth by 2030 without much volatility because demand for EDA software, unlike demand for semiconductors, does not ebb and flow with economic cycles. As such, going forward, the EDA software market represents an excellent way to play the custom AI chip evolution.
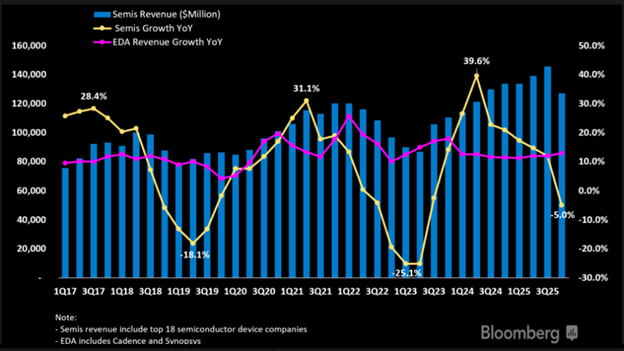 Source: Bloomberg Nvidia () stock was the best play in the first wave of the AI chip boom but EDA software stocks such as Synopsys Inc. () and Cadence Design Systems (), with market shares of about 40% and 30%, respectively, dominate the EDA category and, as such, are well positioned to capitalize on the shift to custom AI chips. Below is more information on those two stocks:Synopsys, Inc. (SNPS): +62.6% YTDDespite its high valuation metrics compared to the sector median (see below), the company is making significant strides in the EDA market.
Market Capitalization: $76.8B;
Forward PE Ratio: 45.5 (HIGH – sector median is 21.4);
Forward PSR: 13.2 (HIGH – sector median is 2.4);
Forward PEG Ratio: 2.6 (SLIGHTLY HIGH – sector median is 1.7);
EV/EBITDA Ratio: 34.9 (HIGH – sector median is 13.1)
Read:
- Cadence, Synopsys Offer ‘Strong Growth, Low Cyclicality’ Amid Chip Industry Unrest: Analyst
Cadence Design Systems, Inc. (CDNS): +63.8%Cadence also boasts a high valuation, but its performance and market position make it a key player in the EDA software industry.
Market Capitalization: $69.8B;
Forward P/E Ratio: 71.1 (HIGH – sector median is 21.4);
Forward PSR: 11.1 (HIGH – sector median is 2.4);
Forward PEG Ratio: 2.8 (SLIGHTLY HIGH – sector median is 1.7);
EV/EBITDA Ratio: 37.9 (HIGH – sector median is 13.1)
Read:
- Investors Heavily Search Cadence Design Systems, Inc.: Here is What You Need to Know
- Calculating The Fair Value Of Cadence Design Systems, Inc.
- Cadence Posts Better-Than-Expected Sales In Q3 But Quarterly Guidance Underwhelms
Definitions
The price-to-earnings ratio (P/E ratio) is the ratio for valuing a company that measures its current share price relative to its earnings per share (EPS) and is used to determine the relative value of a company’s shares in an apples-to-apples comparison to others in the same sector. A high P/E ratio could mean that a company’s stock is overvalued, or that investors are expecting high growth rates in the future. The mean forward P/E ratio for the EDA Software Sector is 21.4.
The price-to-sales ratio (PSR) describes how much someone must pay to buy one share of a company relative to how much that share generates in revenue for the company. and, as such, determines whether its stock is cheap or overpriced in comparison to its peers. The mean forward PSR for the EDA Software Sector is 2.4).
The price/earnings to growth ratio (PEG ratio) is a stock’s price-to-earnings (P/E) ratio divided by the growth rate of its earnings for a specified time period and is used to determine a stock’s value while also factoring in the company’s expected earnings growth, and it is thought to provide a more complete picture than the more standard P/E ratio. The mean forward PEG ratio for the EDA Software Sector is 1.7.
The Enterprise Value-to-Earnings Before Interest, Taxes, Depreciation, and Amortization ratio (EV/EBITDA) is one of the best metrics used by value investors to evaluate a company because it accounts for the value of all financing the company has received from both equity stakes and debt allowing investors to compare profitability between companies. A high means the company is overvalued, while a low ratio indicates it’s undervalued. The mean forward EV/EBITDA ratio for the EDA Software Sector is 13.1.
More By This Author:

