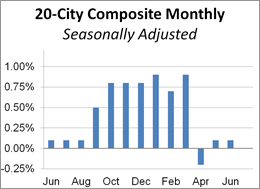
With today’s release of the June S&P/Case-Shiller Home Price Index, we learned that seasonally adjusted home prices for the benchmark 20-city index were up 0.1% month over month. The seasonally adjusted national index year-over-year change has hovered between 4.2% and 5.8% for the last twenty-eight months. Today’s S&P/Case-Shiller National Home Price Index (nominal) reached another new high.

Â
The adjacent column chart illustrates the month-over-month change in the seasonally adjusted 20-city index, which tends to be the most closely watched of the Case-Shiller series. It was up 0.1% from the previous month. The nonseasonally adjusted index was up 5.7% year-over-year.
Investing.com had forecast a 0.2% MoM seasonally adjusted increase and 5.7% YoY nonseasonally adjusted for the 20-city series.
Here is an excerpt of the analysis from today’s Standard & Poor’s press release.
“The trend of increasing home prices is continuing,†says David M. Blitzer, Managing Director and Chairman of the Index Committee at S&P Dow Jones Indices. “Price increases are supported by a tight housing market. Both the number of homes for sale and the number of days a house is on the market have declined for four to five years. Currently the months-supply of existing homes for sale is low, at 4.2 months. In addition, housing starts remain below their pre-financial crisis peak as new home sales have not recovered as fast as existing home sales.†[Link to source]
The chart below is an overlay of the Case-Shiller 10- and 20-City Composite Indexes along with the national index since 1987, the first year that the 10-City Composite was tracked. Note that the 20-City, which is probably the most closely watched of the three, dates from 2000. We’ve used the seasonally adjusted data for this illustration.

Â
For an understanding of the home price data over longer time frames, we think a real, inflation-adjusted visualization of the data is an absolute necessity. Here is the same chart as the one above adjusted for inflation using a subcomponent of Bureau of Labor Statistics’ Consumer Price Index, the owners’ equivalent rent of residences, as the deflator. Among other things, the real version gives a better sense of the dynamics of the real estate bubble that preceded the last recession.

