Stocks continue to consolidate just under their prior high, which is offering formidable resistance. Although many long-standing uncertainties have significantly subsided, others have arisen, including turmoil in a new global hot spot (Ukraine) and the disruptions to the economy caused by the unusually long and brutal winter experienced by most of the U.S. “Polar vortex†is a term most have us had never heard before, but now it is firmly ensconced in the daily lexicon around water coolers everywhere.
Nevertheless, the U.S. economy appears to be poised for stronger growth once the ice clears. But in the short term, the U.S. stock market remains at the proverbial “crossroads†that I discussed last week, which likely will culminate in either a bullish breakout or a bearish reversal. A failure to move higher from here would result in an ominous triple-top sell signal.
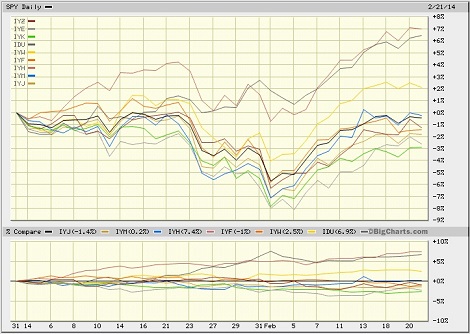
Among the ten U.S. business sectors, Utilities and Healthcare are still far-and-away the top performers so far in 2014. Both are up more than +6% year-to-date through Friday’s close. All-weather sector Healthcare got off to a blistering start in January, while defensive sector Utilities has been steadily rising without weakness, including during the extreme market weakness in late January. Technology is the only other sector that is solidly positive, up about +2% YTD. The S&P 500 is still slightly negative YTD, while the other seven sectors are all tightly bunched at or below the broad index. Notably, if you go back one more month to the end of November, Technology is the top-performing sector due to its strong December during the “risk-on†year-end rally.

Â
Basic Materials have performed pretty well this month. But take a look at pure commodity indexes like the Greenhaven Continuous Commodity Index ETF (GCC). It has been going straight up for the past month. Also, the PowerShares DB Commodity Index Tracking ETF (DBC) has performed well.
SPY chart review:
The SPDR S&P 500 Trust (SPY) closed Friday at 183.89, which is well above its 20-day and 50-day simple moving averages, but it is battling with strong resistance at the 185 level. It remains at the proverbial “crossroads†(at which it arrived last week) that should culminate in either a bullish breakout or a bearish reversal. Also, the Russell 2000 small cap index is still struggling with its former long-standing uptrend line as overhead resistance. Oscillators RSI, MACD, and Slow Stochastic are not giving any clues, as they are simply consolidating a bit and could go either way from here. If SPY can’t break through resistance at 185 and sellers take over, it would create a triple-top sell signal that could send price back down to test support levels at 180, the 100-day SMA near 179, 177.50, 175, and possibly the 200-day near 172.
