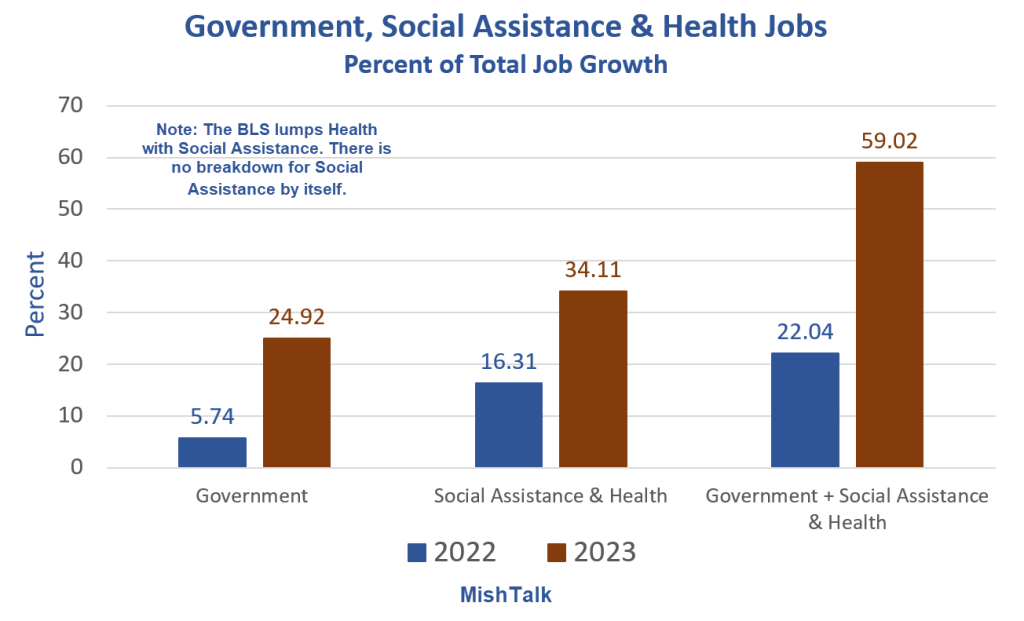
 Jobs data from the BLS, chart by MishWelfare State Surge 2022 vs. 2023
Government employment and Social Assistance at the state level is surging. Much of it can be attributed to the surge in illegal immigration.A portion of healthcare jobs, perhaps a large portion, is demographics. Boomers are getting older. Medicare needs and assistance needs are rising for this reason as well.Change in Government and Social Assistance Jobs(Click on image to enlarge) Jobs data from the BLS, chart by MishGovernment + Social Assistance and Health Is Over 100% of Job Creation in 3 States(Click on image to enlarge)
December state level numbers are not available in the current jobs report, but through November, Does anyone think this is sustainable? If so, for how long?Jobs Up 216,000 But Employment Down 683,000For discussion of the December jobs report please see The decline in full time employment in December was over 1.5 million. Debt Jumps Past $34 Trillion, $1 Trillion Interest, Another Budget Showdown LoomsFinally, please note
Lost in the wake of debt topping $34 trillion is another budget showdown. Will this showdown be like all the other Republican capitulations? And what about the chants of hyperinflation?
For discussion of the debt ceiling and what I expect will happen, please click on the preceding link.More By This Author:

