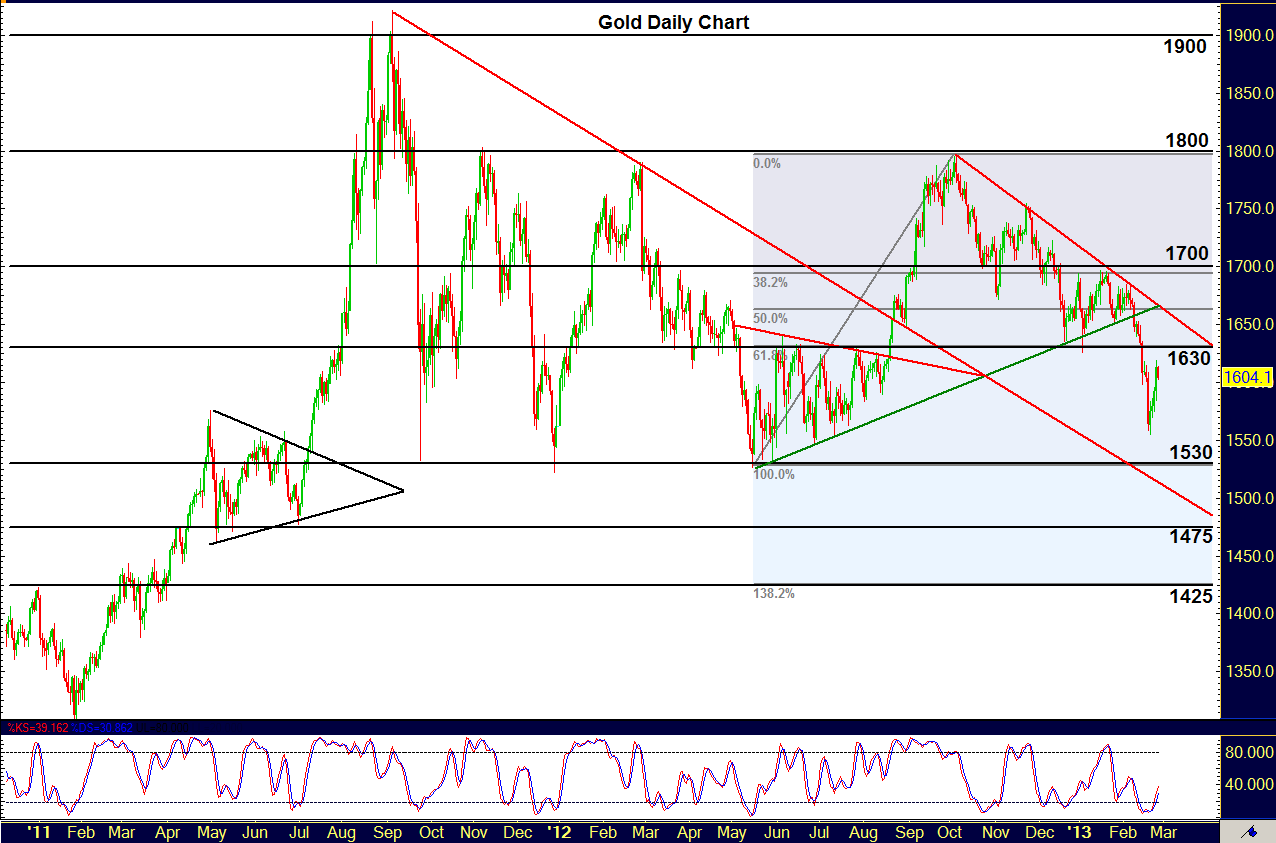

Gold (daily chart) as of February 27, 2013, having been largely rangebound between 1530 and 1800 for the last five months, has made a tentative pause in its rebound of the past week and has stalled just under key resistance around the 1630 price region. This pullback to the upside occurs within a strong short-term bearish trend (within the current trading range) extending back to the October 2012 highs near 1800. The short-term bearish trend has shown regular breakdowns and pullbacks to the upside in the past several months. The most recent breakdown occurred in mid-February, when price broke down below the key 1630 support level, which was also an important 61.8% Fibonacci retracement level of the last bullish run within the trading range.
After that breakdown, the 1630 prior support level has now become a major resistance level. In the event of a turn back to the downside to resume the bearish run within the range, the clear downside objective resides around the 1530 price region, the bottom of the trading range. On any further breakdown below the range, key initial support resides around 1475.To the upside, a breakout above 1630 resistance should find further resistance around the noted bearish trend line extending back to the October 2012 highs near 1800.
James Chen, CMT
Chief Technical Strategist
City Index Group
Forex trading involves a substantial risk of loss and is not suitable for all investors. This information is being provided only for general market commentary and does not constitute investment trading advice. These materials are not intended as an offer or solicitation with respect to the purchase or sale of any financial instrument and should not be used as the basis for any investment decision.


