 Image Source:
The gold price is trading in the red at $2,067 when writing. The precious metal has turned to the downside after reaching today’s high of $2,078.Probably, XAU/USD slipped lower as the US dollar edged higher. Today, the Eurozone reported mixed data, but the traders wait for the US figures before taking action.The Final Manufacturing PMI could jump from 48.2 to 48.4 points, which could be good for the greenback, while Construction Spending may announce a 0.6% growth again. Positive US data should lift the USD. This situation may punish the price of gold.Tomorrow, the US data could be decisive. The ISM Manufacturing PMI could be reported at 47.2 points, which is above 46.7 points in the previous reporting period. The JOLTS Job Openings indicator is expected to be 8.85M in November, above 8.73M in October, while the ISM Manufacturing Prices indicator may be reported at 50.0 points.Still, the most important event is represented by the FOMC Meeting Minutes. As you already know, the FED is expected to deliver a 75 bps cut in 2024, so a dovish report could weaken the USD.
Gold Price Technical Analysis: Sell-Off
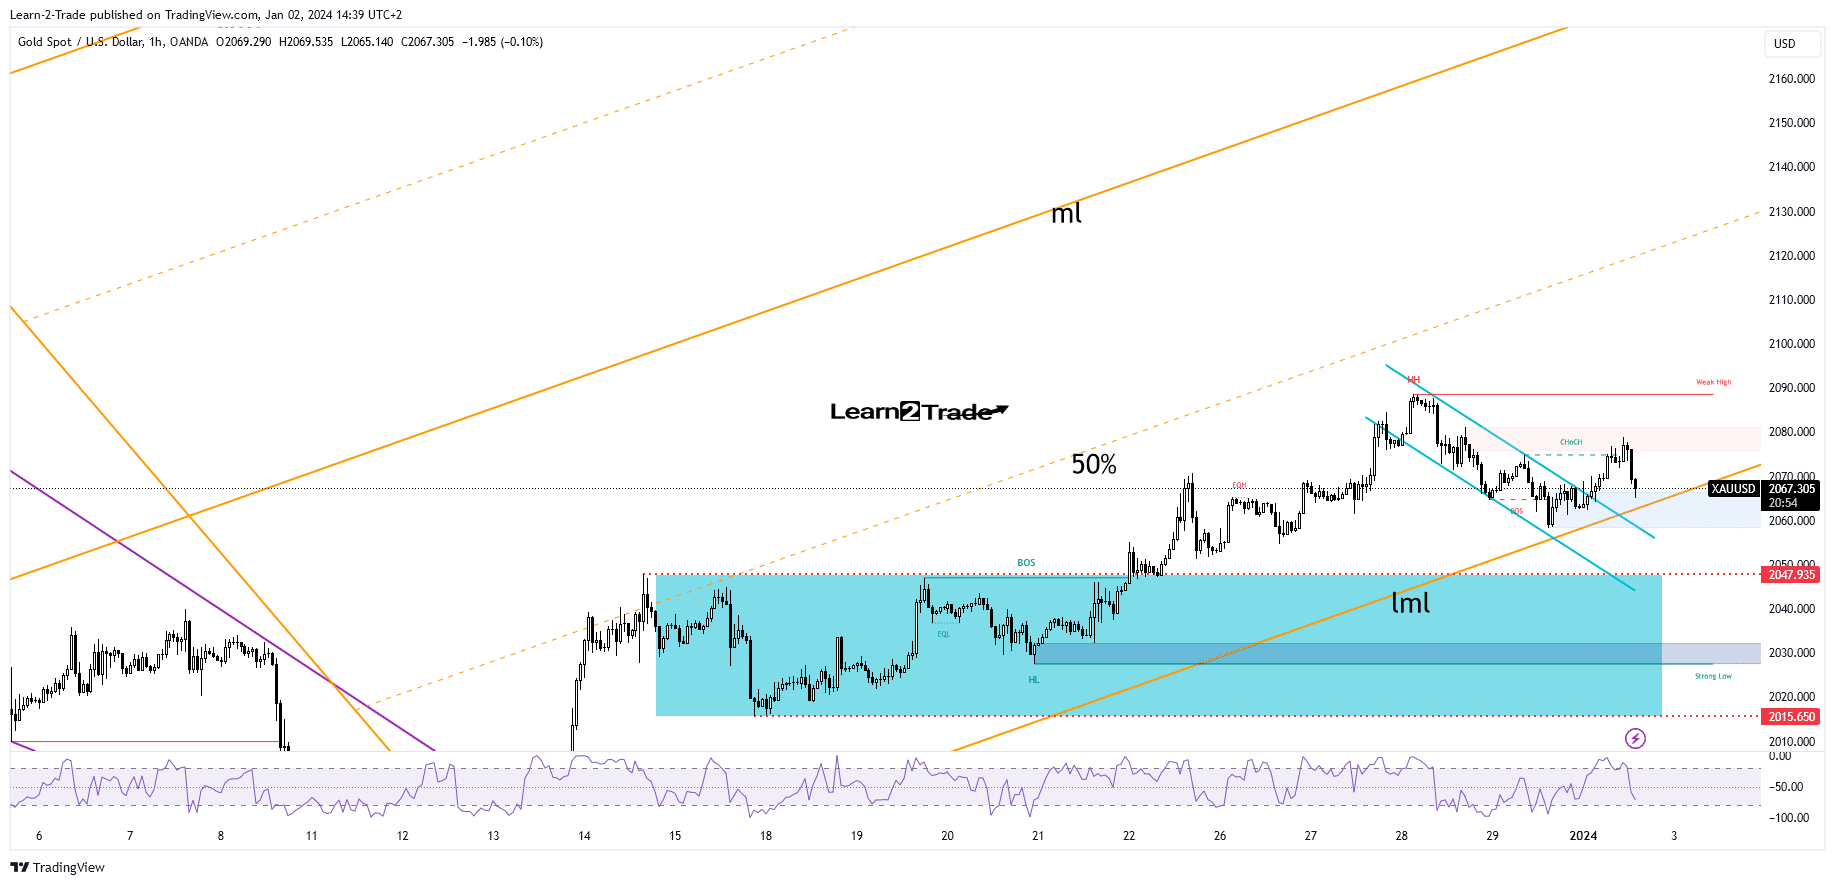
(Click on image to enlarge) Gold 1-hour chartTechnically, the bias remains bullish as long as it stays above the lower median line (LML) of ascending pitchfork.As you can see on the hourly chart, the price broke out of a flag pattern, signaling an upside continuation. Still, after the last rally, a retreat was somehow expected.The metal could retest the demand zone from right above the lower median line (LML) to attract more buyers before jumping higher.False breakdowns below this dynamic support may announce a new bullish momentum. A new higher high, taking out the 2,081 high, activates further growth.More By This Author:
Gold Price Retraces To Demand Zone As Dollar Probes Recovery

