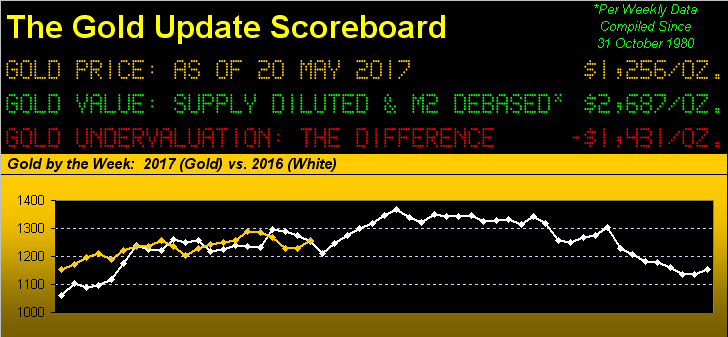
Or as Bill the Bard of Avon might have queried, “Much Ado About Nothing?” Is the StateSide executive branch covertly concealing a felonious act? Or are players in the congressional/media complex destined to go down as the daftest deviants in decades? Either way, Shakespeare himself would be on the edge of his seat over such great theatre. To be sure, the markets certainly have so been, at long last getting their volatility in gear to sport some of their best swings of this year. Indeed for the EuroCurrencies and the S&P 500, this past week was their rangiest year-to-date.
And Gold gained anew in the stirring of the brew, albeit as the above panel shows, price is just about spot on where ’twas at this point a year ago (1253) in settling out the week Friday at 1256. The bulk of the week’s 28-point gain came during Wednesday’s swift 24-point surge; but before we get too carried away, in turning to Gold’s weekly bars, we presently find price all but smack in the center of the purple-bounded 1240-1280 resistance zone, the parabolic Short trend now three declining red dots in duration:

“Uh mmb, why is that trendline down if Gold is where it was a year ago?”
Good to see you doing some scrutineering there, Squire. ‘Tis simply because the slope of the selling therein has been steeper that that of the buying. Which brings up this further point: we’ve noted over the years that, unlike most markets, Gold has a tendency to rise faster than it falls; clearly per Squire’s good question, that has not been the case across the above chart. Moreover, given the geo-(and otherwise)-political climate, Gold has the appearance of underperforming a bit at present as seen in this next chart. Here we have for the last 21 trading days (one month) the percentage price tracks of our primary BEGOS Markets. Note specifically that Gold is off 2% from where ’twas a month ago, but that two of the markets with which Gold oft is positively correlated are firmer, the Bond being “unch” and the Euro being up a solid 4%:

