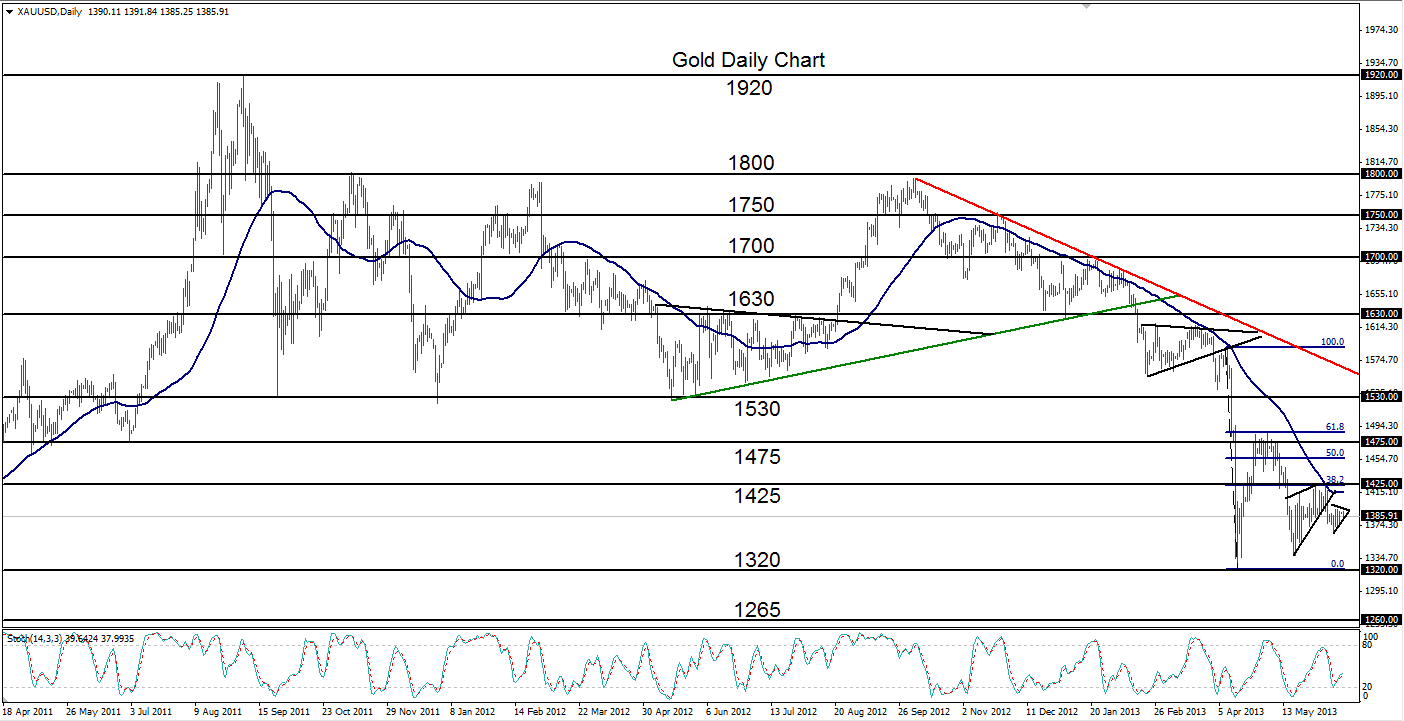

June 17, 2013 – Gold (daily chart) has formed yet another short-term bearish pattern – this time a small inverted pennant pattern that, if fulfilled, could drop the precious metal further down within its entrenched bearish trend. From both medium-term (extending back to October 2012) and short-term perspectives, the trend on gold is clearly to the downside. The dramatic plunge in mid-April made a 61.8% Fibonacci correction to the upside immediately after the drop, but that recovery attempt dissipated and price has since been unable to climb back up.
Most recently, gold formed a rising wedge (generally considered a bearish pattern) that found strong resistance around 1420-25. As was indicated, price subsequently broke down below that wedge and then formed the current small triangle/pennant pattern. This pattern is also generally considered potentially bearish, provided there is a significant break of the pattern to the downside. In this event, price could decline towards a retest of the 1320-area low (last hit in mid-April), and then further down towards objectives around 1265 and 1160.
James Chen, CMT
Chief Technical Strategist
City Index Group
Forex trading involves a substantial risk of loss and is not suitable for all investors. This information is being provided only for general market commentary and does not constitute investment trading advice. These materials are not intended as an offer or solicitation with respect to the purchase or sale of any financial instrument and should not be used as the basis for any investment decision.


