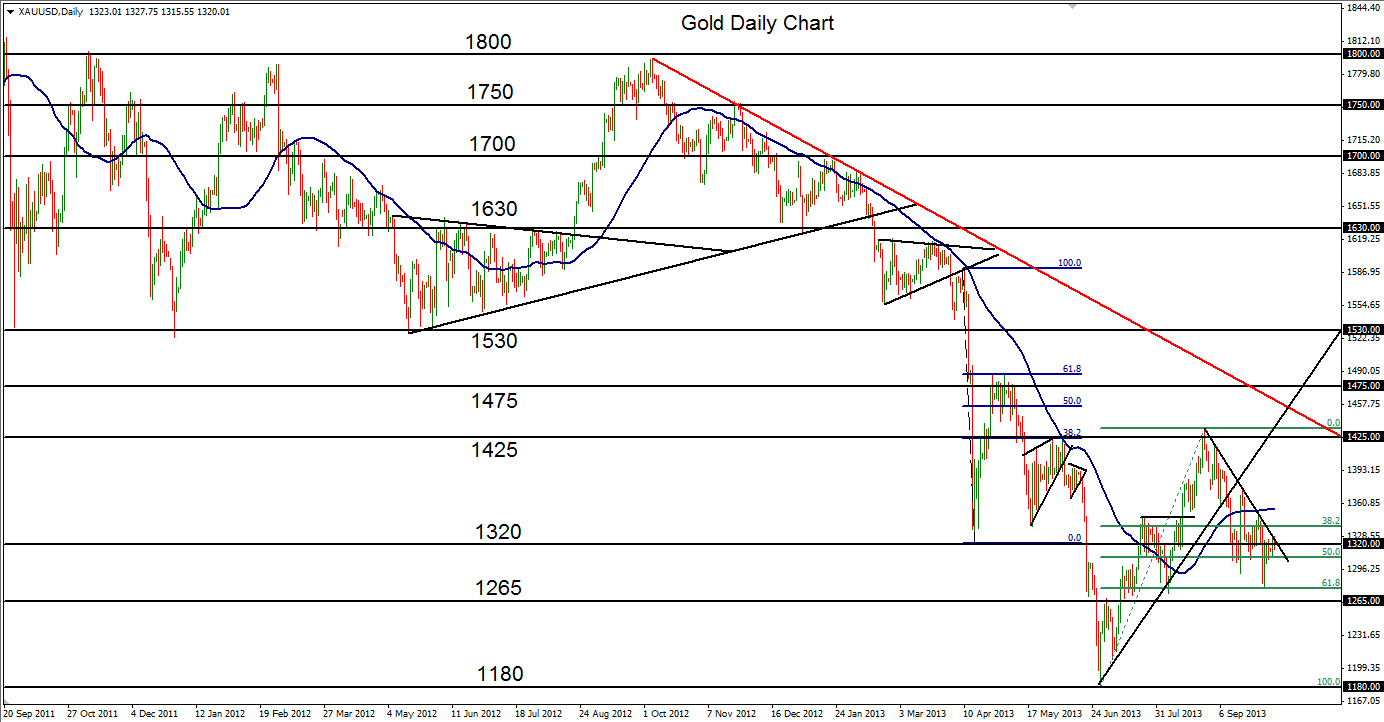

October 8, 2013 – Gold (daily chart) has been following a steadily declining trend line that extends back to the late August high just above 1425 resistance. This short-term declining trend has effectively created a bearish leg within the long-term downtrend that has been in place since the October 2012 highs near 1800 resistance. Currently, the price of gold has rebounded off the recent 1277 low to end up near the noted declining trend line as well as the key 1320 support/resistance level.
A potential continuation of the current bearish leg would be indicated on a breakdown below the noted 1277 low, which is also around the 61.8% Fibonacci retracement level of the recent bullish recovery (from the June 1180 low up to the August 1433 high). In the event of that breakdown, the precious metal could fall further to target a retest of the 1180 support low. Any strong breakout above the short-term declining trend line that also breaks above the 50-day moving average would have an upside objective around the noted 1425 resistance area.
James Chen, CMT
Chief Technical Strategist
City Index Group
Forex trading involves a substantial risk of loss and is not suitable for all investors. This information is being provided only for general market commentary and does not constitute investment trading advice. These materials are not intended as an offer or solicitation with respect to the purchase or sale of any financial instrument and should not be used as the basis for any investment decision.


