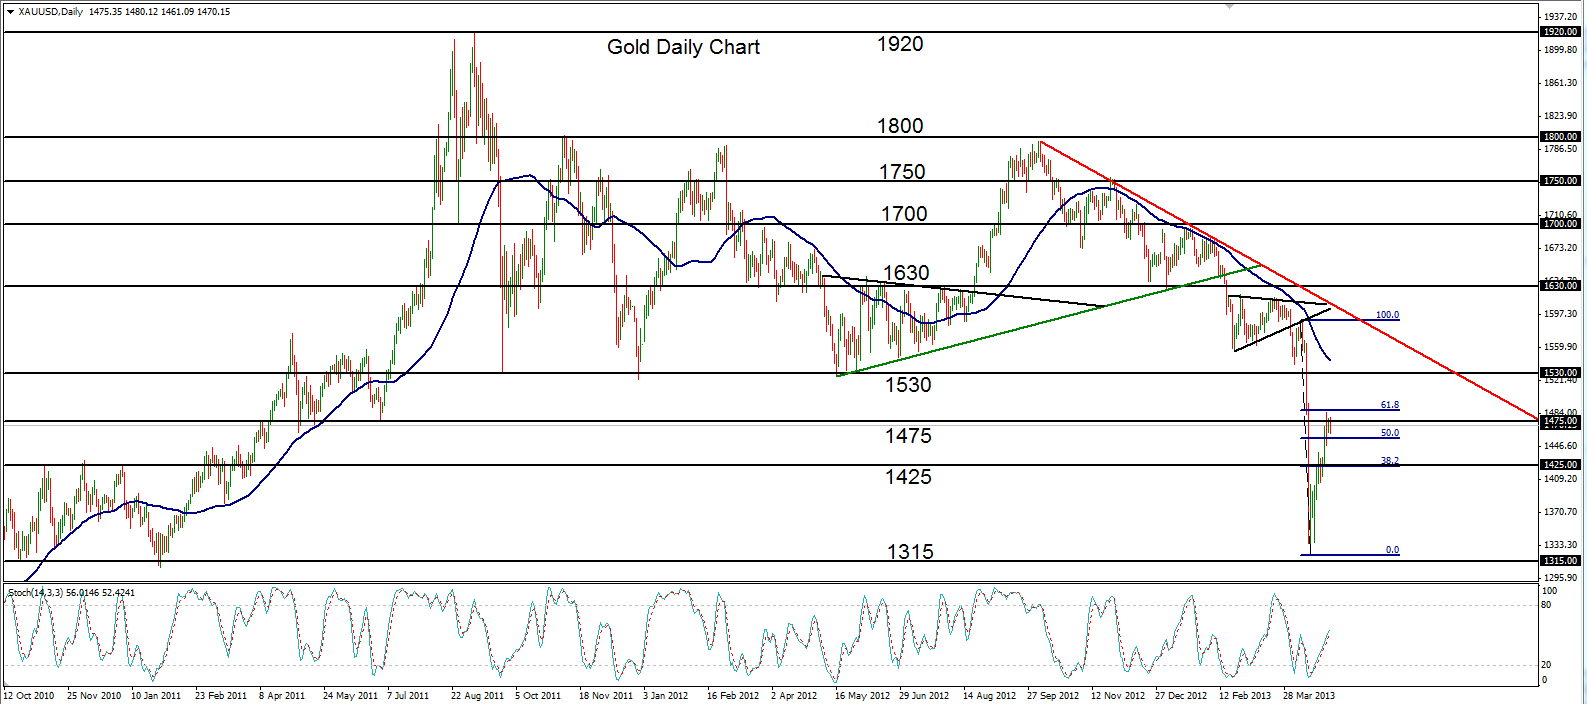

April 30, 2013 – Gold (daily chart) has extended its recovery to the 61.8% Fibonacci retracement level of the precipitous price drop that occurred over just a few days in mid-April. After the drop to more than a 2-year low around 1320, price began its sharp recovery just two weeks ago, climbing back up above key support/resistance levels including 1425 – the 38.2% Fibonacci retracement of the drop. Price then climbed further to find itself now bumping up against key resistance around both the 1475 price level and the 61.8% Fibonacci retracement level. If price is able to further its recovery above this current resistance, major resistance further to the upside resides around 1530, which has long served as a key support level. A turn back to the downside after the current bullish correction within the current bearish trend has downside support objectives around 1425 and 1320 once again.
James Chen, CMT
Chief Technical Strategist
City Index Group
Forex trading involves a substantial risk of loss and is not suitable for all investors. This information is being provided only for general market commentary and does not constitute investment trading advice. These materials are not intended as an offer or solicitation with respect to the purchase or sale of any financial instrument and should not be used as the basis for any investment decision.


