(Click on image to enlarge)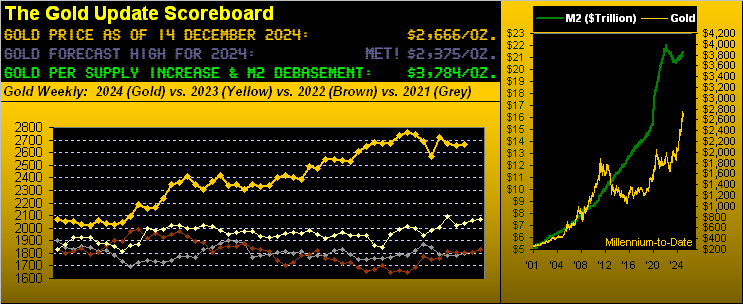
Gold’s net change for this past week was a wee +0.4%; yet ’twas hardly mute en route. Prior to settling yesterday (Friday) at 2666, price was boffed about by another geo-political “spike n’ sink”, further impinged by November’s StateSide inflationary data.Here ’tis: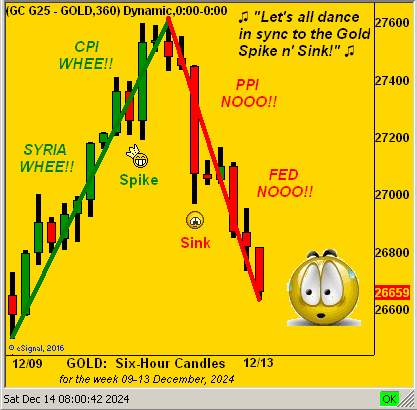
Briefly as to the geo-political “spike n’ sink” — and you regular readers well know this — when Gold “spikes” on geo-political nervousness as was the case this past week over Syria — price zooms upwards.Then swiftly it “sinks” as such jitters fall from the headlines and short-term memories move on to the next event.But when it comes to inflation — even as the FinMedia and investing community couch it as “benign” — you cannot fool the Dollar, nor the Bond, nor Gold.For per the U.S. Bureau of Labor Statistics, inflation at both the retail and wholesale level is increasing, indeed moving further up and away from the Federal Reserve’s desired target of +2.0%.Here’s what we have thus far for November: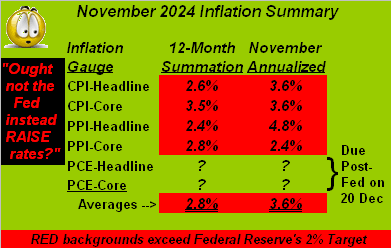
Obviously to complete the above table, we await November’s “Fed-favoured” Personal Consumption Expenditures Prices Index due next Friday, 20 December, which conveniently for the central bank is two days after its Open Market Committee’s 18 December Policy Statement.Regardless, what does our table thus far depict? At its foot we see the average 12-month summation of the elements is +2.8%; through October ’twas +2.6%… Whoops!Moreover, the November annualized average is +3.6%; that for October was +3.0%… Whoops! Time to pick up the telephone and call the Fed: “Hey Jay!We’re goin’ the wrong way!” And yet, they’ll likely lop another 25bps off the Funds Rate come Wednesday, as absent of math, the modern-day Fed apparently acts on optics. “A cut is expected?A cut we shall do!”And given rate cuts effectively increase the money supply through the Fed window, more Dollars distributed into the monetary system (barring economic efficiency) lead to more inflation.For more are worth less; the “wrong way”, indeed. However, to read the also math-challenged FinMedia, increasing inflation is not their take.Hat-tip Bloomy, which in response to rising retail inflation (the Consumer Price Index) ran on Wednesday with “Stocks Rise After CPI Gives Fed Green Light to Cut”. Really?The CPI quickened its October pace of +0.2% to +0.3% for November … which annualized as noted is +3.6% … which further distances itself from the Fed’s +2.0% target. That’s a green light to cut? But wait, there’s more:into Wednesday evening Bloomy embellished its response by adding “US Inflation in Line With Forecasts Solidifies Bets on Fed Cuts”. Really?We can only guess that —again mathematics aside — merely meeting forecasts is all that counts, even as inflation increases.This is adroitly akin to contemporary stock market valuation:the substance of earnings (or lack thereof) no longer has meaning, just as long as they “beat estimates”.Thus Syria + CPI = Spike. ‘Course come Thursday came the negative news. Wholesale inflation (the Producer Price Index) for November recorded a +0.4% pace, the fastest across the past seven months… Whoops!But whilst the FinMedia rather skirted the issue, not so did the Dollar, nor the Bond nor Gold, the rationale being that perhaps the Fed shan’t cut.In turn, the Dollar got the Bid, the Bond did the skid, and Gold hit the lid. PPI + Rate Doubt = Sink.So as we go to Gold’s weekly bars from a year ago-to-date, the rightmost closing nub shows barely a net change from a week ago — despite the “spike n’ sink” — as the parabolic Short trend continues.Today at 2666, Gold sits -116 points below the ensuing week’s flip-to-Long level of 2782; thus if you’re scoring at home, given Gold’s expected weekly trading range is now 90 points, ’tis likely the Short trend shall still be in place in a week’s time: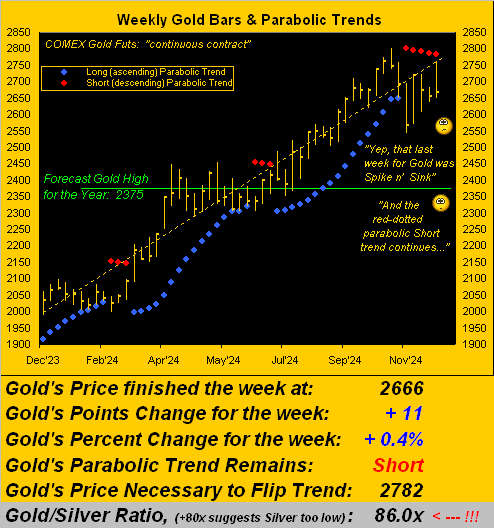
Now as noted, we expect the Fed — wrongly — to cut.‘Tis even priced into the FedFundsFutures despite the firming of the Dollar — rightly — and attendant weakness in the Bond and Gold. And truly for the trader, mis-valuation breeds opportunity; the trick however is to remain solvent until everyone else sees it. To wit for the Casino 500, its “live” price/earnings ratio settled yesterday at a spritely 47.8x. Fundamentally, that is an overbought danger which has become indescribable. Technically, we’ve also these year-to-date stats:the S&P has recorded 241 trading days; ’tis been “textbook oversold” for just 28 days, at a neutral stance for 51 days, and “textbook overbought” for 162 days, including through 42 of the last 46 days.To be sure, we’re taught “the market is a hedge against inflation.”We just displayed annualized inflation running at +3.6%; the S&P year-to-date is +27%.But we get it:all that COVID-elicited $7T is still sloshing around in the stock market.
“Plus, it’s just in time for the Santa Claus Rally, eh mmb?” So sayeth conventional wisdom, Squire.But it doesn’t always come to pass.There remain seven trading days until Santa’s arrival.How has the S&P historically fared for such seven days?We went all the way back to 1980 (which for you WestPalmBeachers down there covers the past 44 years).And yes, there generally is an upside bias for the seven trading days to Christmas, yet:in 13 (30%) of those years, such seven-day stint was net negative for the S&P.Thus “buyer beware”.
Either way, the frightening overvaluation of the S&P 500 reminds us yet again that “marked-to-market everyone’s a millionaire; marked-to-reality nobody’s worth squat.” Always worth its plot however is that of the Economic Barometer.As many of you know, the Baro across its first 22 years essentially led the direction of the stock market as measured by the S&P 500.But then came COVID after which such relationship ceased.(Did we mention the S&P is overbought?)Going inside the data of the past week’s 11 incoming metrics for the Econ Baro, period-over-period saw three improve, two maintain, and six worsen, the latter leaning in favour of a Fed cut as the analytics included a significantly lower revision to Q3’s Unit Labor Costs, plus the highest level of Initial Jobless Claims across the past nine weeks.Besides, the FinMedia have already ordered (as usual) the Fed to cut its Funds Rate: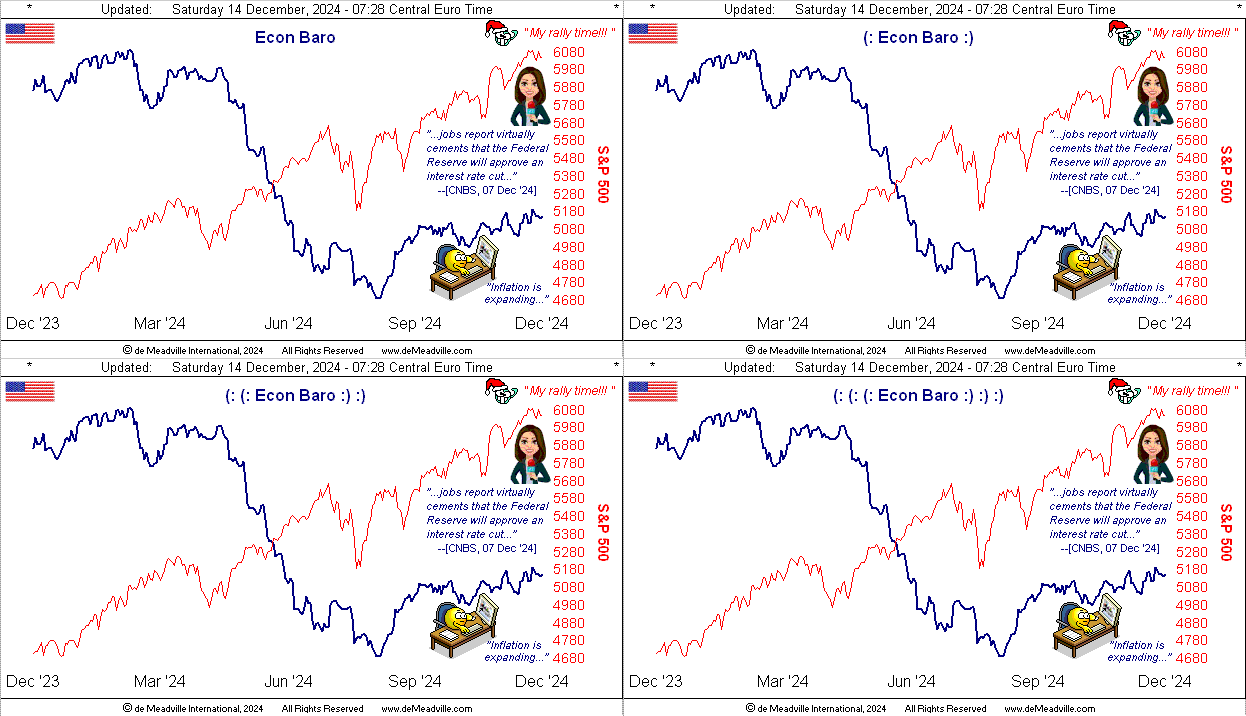
Indeed speaking of rate, that at which Gold did the “spike n’ sink” was quite quick this past week.‘Tis again very evident below in the left-hand panel of price’s daily bars from three months ago-to-date, the baby blue dots of trend consistency just Friday having kinked lower.In the right-hand panel we’ve Gold’s 10-day Market Profile, the range of which spans 124 points; currently 2666, price sits just above its most commonly traded handle — labeled at 2664 — across the fortnight: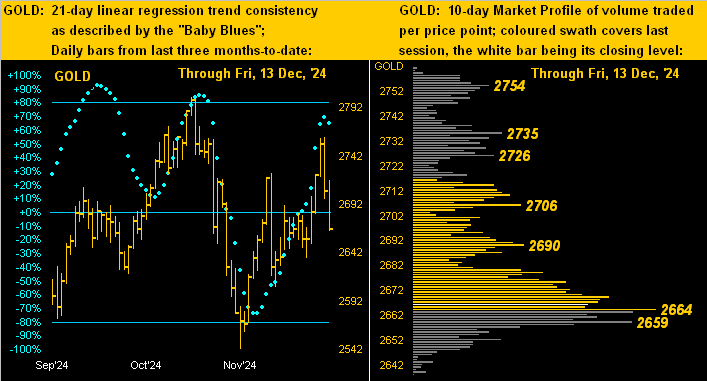
And we’ve the same drill for Silver, her “Baby Blues” at left also having just kinked lower yesterday.Then at right per her Profile, she is sitting on her last bastion of near-term support at 31.00. Hang in there Sister Silver!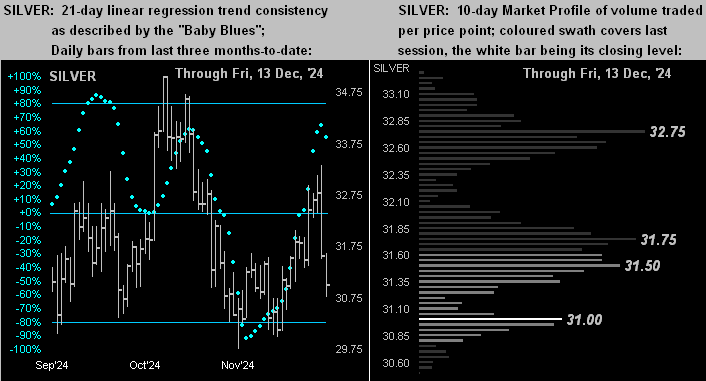
Thus into a very busy “Fed Week” we go during which 19 metrics come due for the Econ Baro, 10 that are scheduled prior to the FOMC’s Policy Statement late Wednesday.Since the FinMedia have assured us the Fed will cut, is that already priced into Gold? But then again, hearsay has it the Bank come 29 January shall “pause” post-Santa Claus; so hold any applause.And always make sure you’ve some Gold in your claws! More By This Author:

