E-Wave Counts Revisited
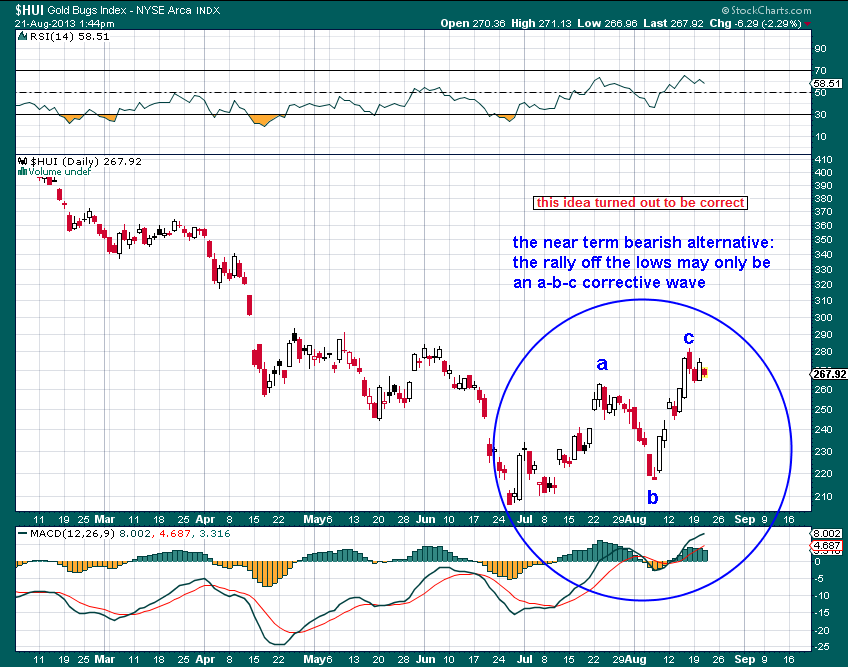
In late August, we looked at a few short, medium and long term wave count alternatives for the HUI (see “Gold and Gold Stocks, What Comes Next†for details). We want to revisit the topic to see where things now stand. At the time, our main assumption was (and remains) that the entire long term structure since the March 2008 high is a large degree corrective wave. Since the low in late June 2013, it became clear that some sort of bottoming formation was likely underway, not least as the extent of the bear market from the 2011 high was roughly the same as that of the most severe bear markets in the sector since the 1940s. However, it was of course not certain how things would play out in detail. With hindsight, it turned out that the near term bearish alternate count reproduced below was the correct idea (we also considered a more bullish alternative, as well as a ‘short term bullish, medium term bearish alternative’ shown further below).

This was an idea from our late August update that turned out to be correct – click to enlarge.
We were wondering at the time whether the long term wave ‘C’ was or wasn’t finished yet. As you will see further below, that question can still not be answered with absolute certainty, but we have a few positive indications from ancillary technical indicators that suggest wave C may have ended. First a look at the above mentioned ‘short term bullish, medium term bearish alternative’Â we also pondered in August, in the context of the formation of the fourth and fifth waves of C. We now know that this view was too optimistic in the short term, but otherwise, namely in terms of the general shape and timing of the formation subsequently traced out by the market, it was fairly close to the mark. Had we used the point marked ‘c’ in the chart above as the high point for wave four, we may well have gotten it perfectly right:

The idea proposed in August for waves 4 and 5 of C – too optimistic regarding the short term, but otherwise it seems the idea was sound – click to enlarge.
If we look at what has since then happened, the market did indeed make a low in late December, only the formation started from a lower peak and was more downwardly slanted, in the process making a new low. However, in spite of following the above template pretty closely, this has created a new problem. The problem is that the putative fourth wave looks a bit small relative to wave 2, both in terms of size and duration. It can therefore not be ruled out that wave 4 is not finished yet (as per the ‘alt’ count in red on the next chart).
On the other hand, if one looks at the daily chart, the decline from the late August high looks actually very much like an ending diagonal. Furthermore, numerous divergences have developed at the lows between prices, RSI, MACD, trading volume, the bullish percent index and sentiment indicators on both daily and weekly charts in the shares and the metal. Typically such divergences are associated with major trend changes, or let us better say: the longer prices manage to hold above the levels they inhabited at the time the divergences were created, the more likely it is that a major trend change has occurred.
So there is still a possibility that wave C needs at least one more downturn (namely a 5th wave), but there is a lot of evidence mitigating against that outcome. On the other hand, even if it were to happen, it would still be part of a bottoming process, so from a longer term perspective it is nothing to be feared. In the short term, the recent bullish trend must be regarded as intact, as long as pullbacks hold above recently broken resistance levels.
