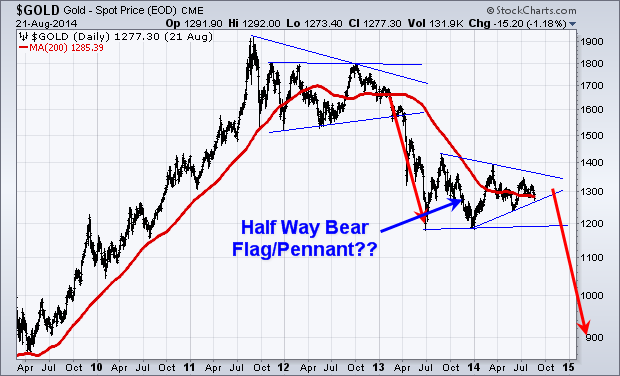
Everyone has been calling for a bottom in Gold the last year. But the fact is that gold and gold stocks are still clearly in a bear market. Just look at the 200 day moving averages. The previous trends were down and prices have been moving sideways for the past year.
A lot of newsletter and analysts are calling a bottom. Technically it’s just a consolidation pattern. Consolidation patterns are a continuation pattern, meaning if the previous trend was down, which it was from 2011 till now, the odds favor price will continue lower after this consolidation.

If this consolidation does happen to be the bottom then we can classify it as a stage I base. Gold and gold stocks will start a new bull market, but price needs to break to the upside of this consolidation pattern. Until it breaks to the upside, it is still in a down trend.
Gold topped out over three years ago. And I am in no rush to try to pick a bottom and be a hero here. I’m just going to continue waiting on the sidelines until price confirms either a new bull market has started or for price to breakdown and we get another leg lower.
Â
Oil Outlook
Taking a look at the big picture of crude oil the chart looks bearish. It too has been trading in a range since 2011 and the price is nearing the apex of a consolidation pattern.

It’s important to know that a pennant formation which is what crude oil has formed are the most predictable when price breaks out of the pattern within the first 1/3rd of the formation.
The longer price consolidates and gets squeezed into the narrowing apex of the pennant pattern, the more unreliable. The trend breakout will be, and it becomes at best a 50/50 bet.
Crude oil’s previous trend was up, but it’s been consolidating for such a long time that price is now squeezed into the apex. This negates that bias for the previous trend to hold true so we have no idea which why it will breakout but when it does expect an explosive move.

