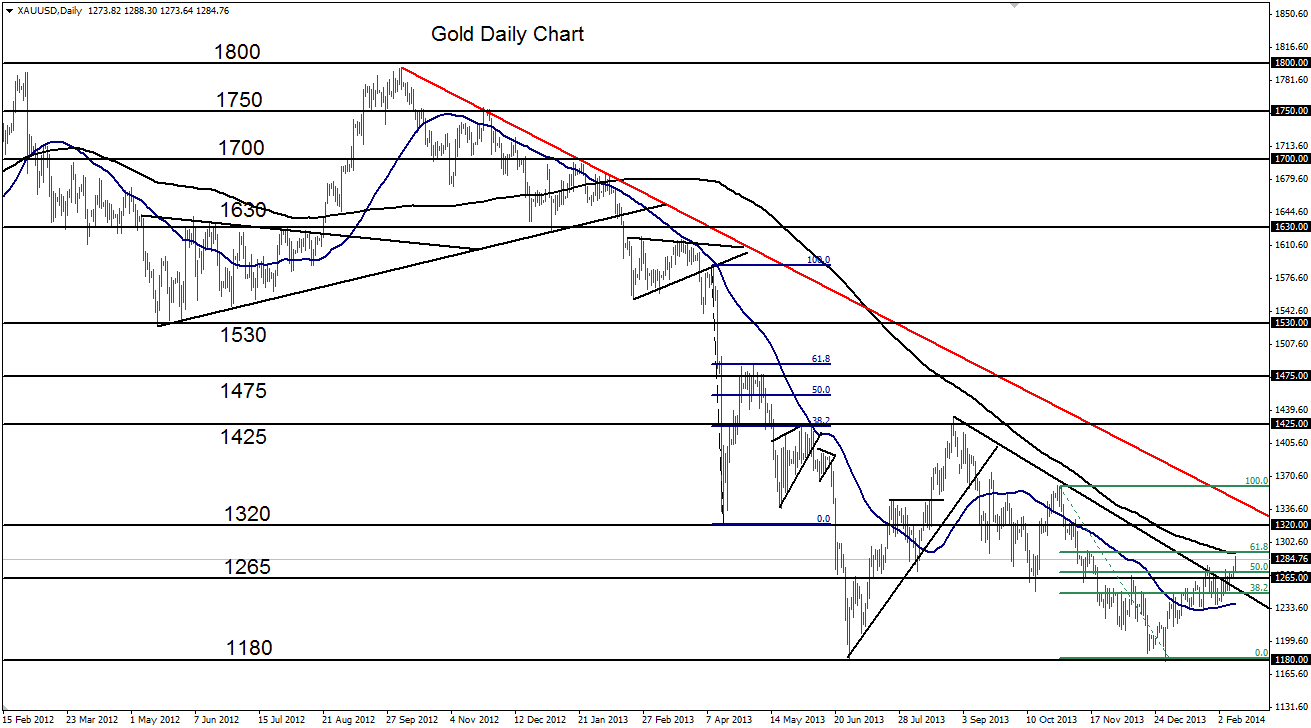

February 11, 2014 – Gold (daily chart) has furthered its general advance of the past six weeks after having established a double-bottoming pattern around the 1180 support level towards the very end of 2013. That low was a re-test of the June 2013 low at 1180. Since the beginning of 2014, gold has risen steadily above several key resistance levels, suggesting that the precious metal may tentatively be in the midst of bottoming out. Since rising above its 50-day moving average in mid-January, the price of gold has gone on to breakout recently above both the key 1265 resistance area as well as a major downtrend line extending back to the August high at 1433.
Currently, price has risen even further to touch both its 200-day moving average as well as the key 61.8% Fibonacci retracement of the last major price decline. With this confluence of resistance directly above, gold is at a critical technical juncture. A breakout above this resistance would extend the bullish momentum, potentially targeting further key resistance around the 1320 level and then the long-term downtrend line extending back to the 1800-area high of October 2012. Short-term downside support currently resides around the noted 1265 support/resistance area.
James Chen, CMT
Chief Technical Strategist
City Index Group
Forex trading involves a substantial risk of loss and is not suitable for all investors. This information is being provided only for general market commentary and does not constitute investment trading advice. These materials are not intended as an offer or solicitation with respect to the purchase or sale of any financial instrument and should not be used as the basis for any investment decision.


