- GBP/USD has been struggling by a vaccine snag.
- Fed Chair Powell’s speech may weigh on the dollar.
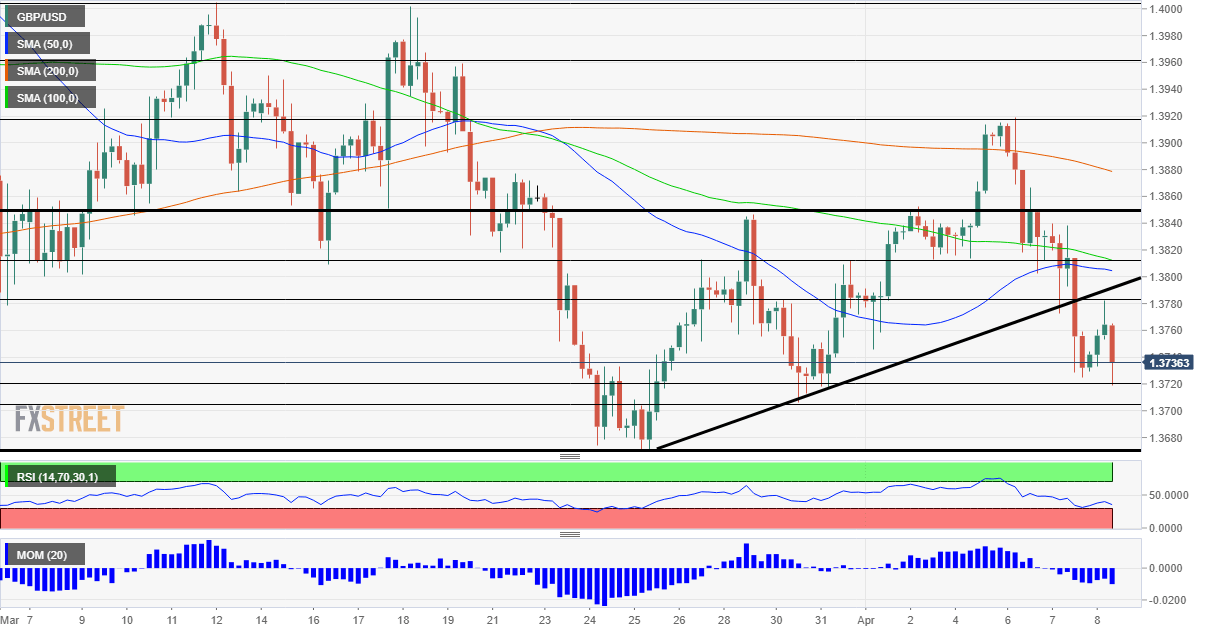
- Thursday’s four-hour chart is painting a bearish picture for the pair.
“A course change” – is how UK officials have described the decision to deprioritize using AstraZeneca’s jab for those under 30. While Britain is ahead in vaccinating its population against COVID-19, fear that AZ’s immunizations may cause blood clots may put off some people from this inoculation and perhaps others.
Sterling has been on the back foot after the separate announcements from both British and EU regulators that there is a link between rare thrombosis cases and the jab. Nevertheless, even though there were only around 80 incidents per 20 million people in Britain – a 1 to 250,000 chance of a clot, concerns are taking over.
GBP/USD has been able to stabilize after the Federal Reserve’s meeting minutes have shown an ongoing commitment to support the economy despite an improving outlook. The world’s most powerful central bank wants outcomes, not outlooks for rising inflation before considering the withdrawal of stimulus.
The reaction to that Fed document from three weeks ago may become minor in comparison to hearing an updated view from Federal Reserve Chair Jerome Powell later on Thursday. At the International Monetary Fund gathering, Powell will able to share his views on the recent encouraging jobs figures. These include an increase of nearly one million jobs in March.
However, if he reiterates that the bank is here to help out – or “not even thinking of thinking of raising rate” – the greenback could fall, allowing cable to recover.
Ahead of Powell’s speech, the US releases jobless claims figures for the week ending April 2, and economists expect an improvement on that front.
See US Initial Jobless Claims Preview: Running on parallel tracks
Overall, pound/dollar has room to recover, taking advantage of the greenback’s weakness rather than sterling strength.
GBP/USD Technical Analysis

Cable still suffers from downside momentum on the four-hour chart and has failed to recapture the broken uptrend support line. It is also trading below the 50, 100 and 200 Simple Moving Averages, a bearish sign.
Support awaits at the daily low of 1.3720, followed by 1.37, a low point from late March, and then by last month’s low of 1.3670.
Resistance is at 1.3780, the daily high, and the by 1.3815, which was a cushion earlier this week. Critical resistance is at 1.3850, which was a stubborn cap.


