The GBP/USD price analysis shows weaker consumer spending in the UK, which has pushed the pound to a six-month low. On the other hand, the US labor market remains resilient, reducing Fed rate cut expectations.Data on Friday revealed that retail sales in the UK fell by 0.7% in October, compared to estimates of a 0.3% drop. The decline in sales is a clear indication that consumer spending is weak. This follows other economic reports showing a slowdown in the UK economy. Notably, GDP data showed that the economy only expanded by 0.1% in the third quarter. Adding fuel to the fire, the UK PMI reading for both services and manufacturing missed the estimates. The negative figures may keep lasting pressure on the pound throughout the current trading session.If this trend continues, the Bank of England might be forced to change the timing for rate cuts. Initially, experts believed the new government budget would boost economic performance. However, so far, economic data has shown the opposite.On the other hand, the US economy has remained resilient despite high interest rates, keeping policymakers cautious. Data on Thursday revealed that initial jobless claims unexpectedly fell last week from 219,000 to 213,000. Meanwhile, economists had expected 220,000 claims.Labor market resilience has kept the Fed from rushing to lower borrowing costs. At the same time, Trump’s recent win has shifted the outlook for economic growth and inflation. His policy changes might boost growth and lead to a spike in inflation. High inflation will force the Fed to keep interest rates at a restrictive level, which is bullish for the dollar. GBP/USD key events today
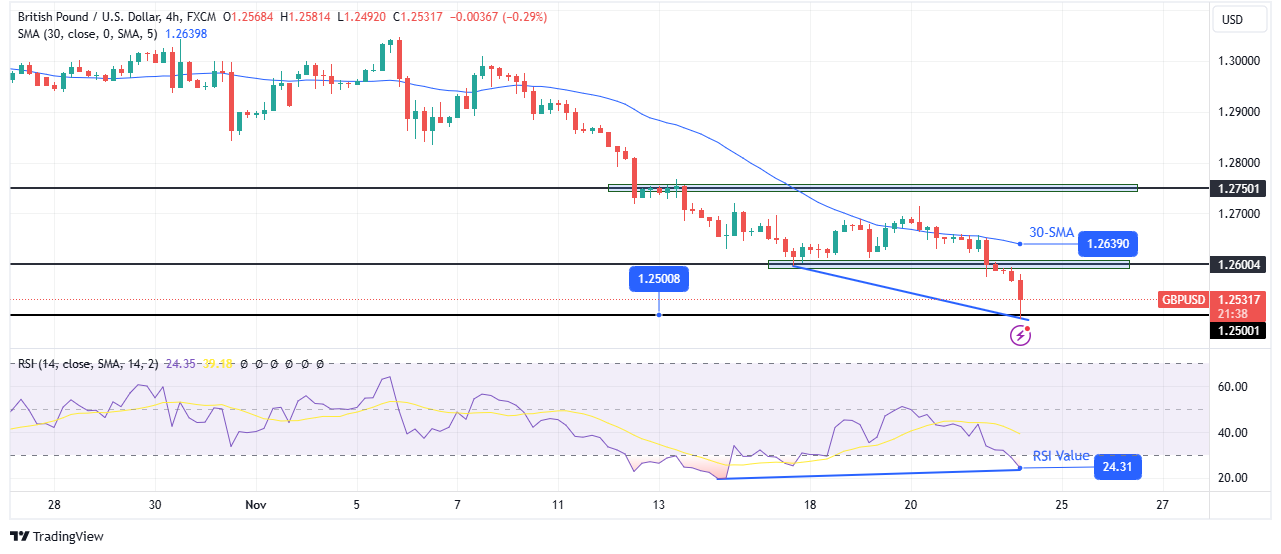
GBP/USD technical price analysis: Bears trigger a decline to the 1.2500 support(Click on image to enlarge) GBP/USD 4-hour chart On the technical side, the price has broken below the 1.2600 support level to make a new low near the 1.2500 key psychological level. The new low indicates a continuation of the downtrend after retesting the 30-SMA resistance. However, the RSI has made a slight bullish divergence. While the price has made a lower low, the indicator has made a higher one. This is a sign that bearish momentum is fading and could lead to a reversal. However, if the price stays below the 30-SMA, bears might eventually breach the 1.2500 support level.More By This Author:USD/CAD Price Analysis: Canada Inflation Exceeds ProjectionsGBP/USD Forecast: UK Inflation Surprise Briefly Lifts PoundUSD/JPY Outlook: Ueda’s Hawkish Remarks Boost Yen

