- GBP/USD has retreated from the highs amid fresh US inflation fears.
- Britain’s reopening, the improving political landscape and BOE’s move toward the exits are already in the price.
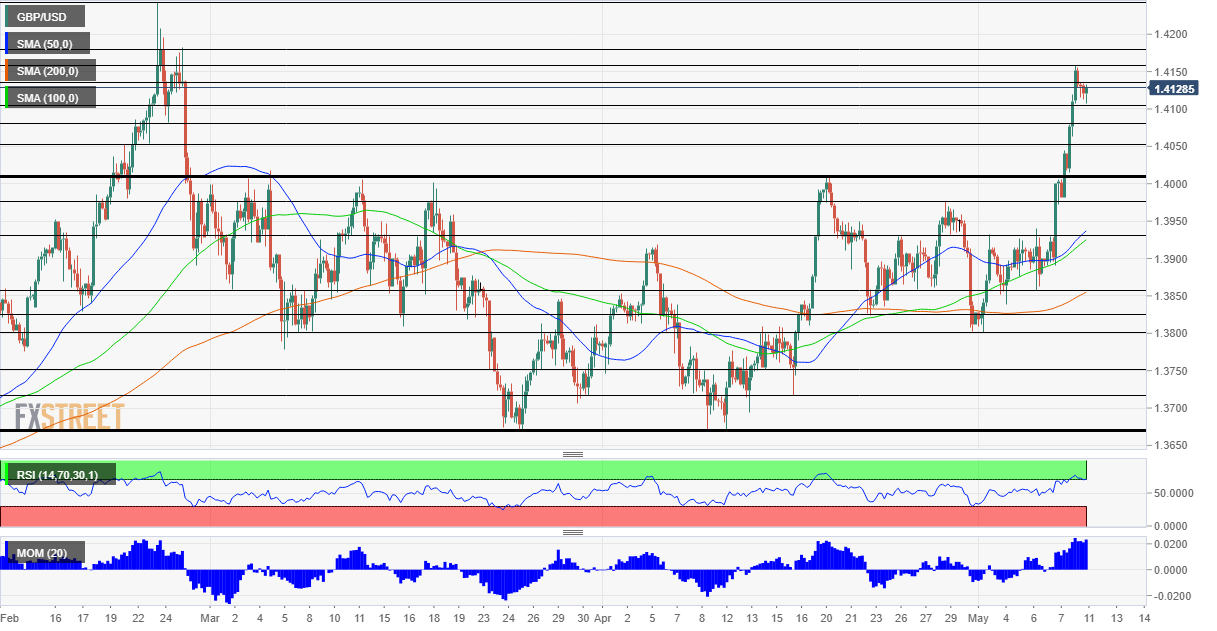
- Tuesday’s four-hour chart Is pointing to an extended downside correction.
What goes up, must come down – even for the sake of resuming its gains again. GBP/USD has been fueled by pound-positive news, but a correction had been overdue after the massive rally. The trigger for the downside consolidation is the specter of inflation, which dominates the conversation in financial markets.
Dallas Federal Reserve President Robert Kaplan reiterated his warnings about an overheating US economy, and his words overshadowed that of his colleagues, who repeated the line that rising prices are temporary. Moreover, China’s producer prices beat estimates, showing that increases in commodity costs are creeping into other areas of the economy.
That changed the market mood and allowed the safe-haven dollar to rise, alongside an increase in Treasury yields. Will this continue? Investors are holding their breaths ahead of Wednesday’s US Consumer Price Index statistics for April.
US Consumer Price Index April Preview: The two base effects on inflation
The wait for the data may keep the lid on cable, despite sterling’s impressive list of reasons to rise. The Bank of England’s slowing down of its bond-buying scheme last week kicked off sterling´s gains. Another booster came from Scotland, where the Scottish National Party fell short of an absolute majority, slowing their strive for an independence referendum. Last but not least, Britain’s consistent march toward returning to normal – with the next phase due on Monday.
The UK is emerging from lockdown and Wednesday’s Gross Domestic Product figures for the first quarter will show how the country faired during the worst period.
UK GDP Preview: Contraction to trigger correction? Sterling set for a reality check
All in all, pound/dollar has good reasons to rise, but it may hesitate ahead of critical data releases.
GBP/USD Technical Analysis

The Relative Strength Index (RSI) on the four-hour chart is just around 70 – overbought conditions. On the other hand, momentum remains to the upside and cable is till below the yearly highs.
Some resistance is at the daily high of 1.4145, followed by the May peak of 1.4160. Further above, 1.4180 and 1.4240 await the pair.
Support is at 1.41, the round number, followed by 1.4070, 1.4050 and 1.4010.


