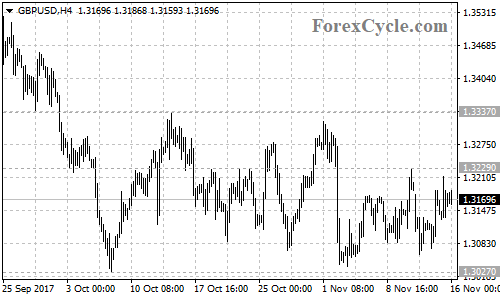
GBP/USD is now facing 1.3229 resistance. A break above this level could take price to next resistance level at 1.3337. Above this level could trigger further upside move to 1.3470 area.
However, as long as 1.3337 resistance holds, the sideways movement in the trading range between 1.3027 and 1.3337 could be treated as consolidation of the downtrend from 1.3657 (Sep 20 high), and a breakdown below 1.3027 support will signal resumption of the downtrend, then the following downside movement could bring price towards 1.2774 support.