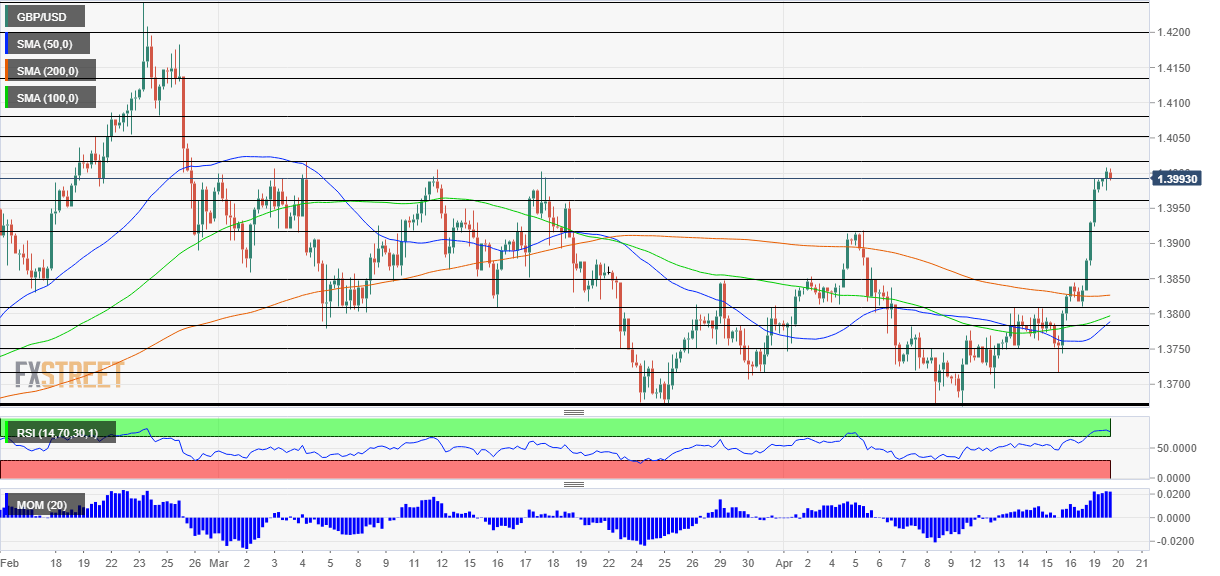
- GBP/USD has conquered the 1.40 level, taking advantage of dollar weakness.
- Reactions to the UK’s jobs report and US infrastructure developments are eyed.
- Tuesday’s four-hour chart is showing cable is in overbought territory.
No fewer than 340 pips in just over one week – has GBP/USD gone too high, too fast? That is what the charts are pointing to, but relentless dollar weakness may result in further gains for cable.
The greenback is on the back foot as US Treasury yields remain on relatively low ground and despite the recent uptick. Returns on benchmark ten-year bonds are around 1.60%, maintaining a safe distance from the cycle high of 1.77% but above the recent lows of 1.55%.
The market mood remains upbeat about the American economy, which is roaring back and helping lift other economies. This “risk-on” mood weighs on the safe-haven dollar, and this greenback weakness now has a life of its own – it continued despite a decline in US stocks on Monday.
Another factor in play for the dollar is speculation about US infrastructure spending. President Joe Biden met a bipartisan group of members of Congress and talks remain at an initial phase. The White House wants to fund its $2.25 trillion plan via tax hikes, which imply lower debt issuance. Additional headlines from Washington are set to move markets.
On the other side of the pond, the UK continues benefiting from Britain’s vaccination campaign. After running quickly with first doses, the UK fully immunized ten million people – a remarkable catch-up with second jabs. Infections and hospitalizations continue falling, despite the country’s gradual reopening.
The pound has also received a boost from UK labor figures. The Unemployment Rate surprised with a drop to 4.9% in February, and the Claimant Count Change surprised with only a minor increase of 10,100 in March. Britain’s labor jobs market seems to have weathered the lockdown months and is ready to spring higher.
All in all, sterling has reasons to rise while the picture for the dollar is more complex.
GBP/USD Technical Analysis
Pound/dollar is in overbought territory – the Relative Strength Index (RSI) is significantly above 70, implying an imminent downside correction. On the other hand, such a downside move would still leave momentum to the upside. Moreover, the currency pair is trading substantially above the 50, 100 and 200 Simple Moving Averages (SMAs).
All in all, the graph is pointing to a setback followed by gradual gains.
The daily high of 1.4008 nearly converges with the March peak of 1.4015, and this area is critical for the next upside moves. It is followed by 1.4050, 1.4075 and 1.3130, which all played a role back in February.
Some support awaits at 1.3960, which was a swing high in mid-March. It is followed by the early-April peak of 1.3920, and then by 1.3850, a temporary resistance line on the way up.
The pause that refreshes: Are currency markets hesitant to run with US data?


