GBPAUD pair is now breaking out of a projected bullish abcde running triangle pattern. And, because of a break out of a triangle, it means it’s breaking ouf wave (b) into a wave (c) of a corrective recovery, but there can be still space up to around 1.97 area before it finds the resistance.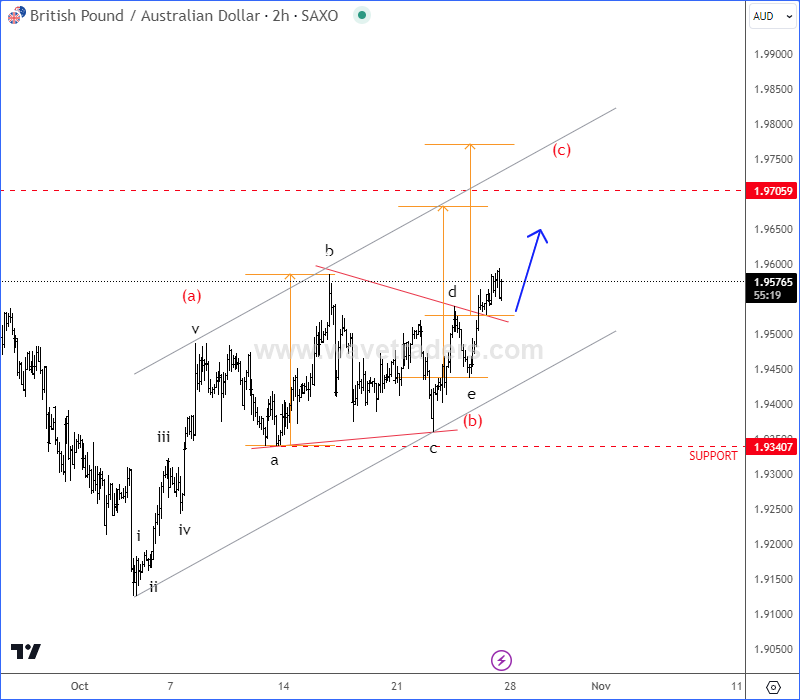 GBPAUD 2h Chart GBPNZD is breaking out of projected subwave (iv) running triangle into final subwave (v) of »c« of a correction, but before bears show up again, we still see room up to 2.17 – 2.18 resistance area.
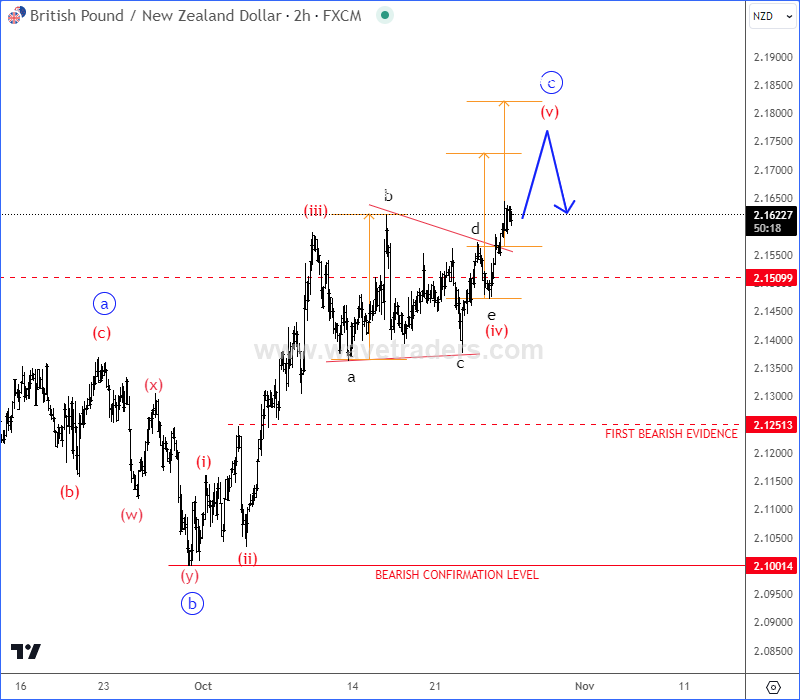 GBPNZD 2h Chart A triangle appears to reflect a balance of forces, causing a sideways movement that is usually associated with decreasing volume and volatility. The triangle pattern contains five overlapping waves that subdivide 3-3-3-3-3 and are labeled A-B-C-D-E. The running triangle is a region of horizontal price movement, a consolidation of a prior move, and it is composed of “threes.” That means each of the A-B-C-D-E waves have three subwaves. The triangle pattern is generally categorized as a continuation pattern, meaning that after the pattern completes, it’s assumed that the price will continue in the trend direction it was moving before the pattern appeared. However, triangles also indicate that the final leg is coming before a reversal and that’s why triangles are labeled in wave B, wave X or wave 4.
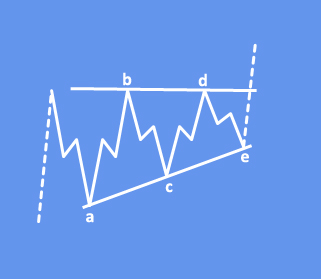 Basic bullish running triangle patternMore By This Author:
GBP/AUD And GBP/NZD Pairs Step Into Final Leg Of A Recovery

