
are out, for responses as of 12/4. here.Survey median GDP matches the SPF November outlook pretty well, taking today’s GDPNow nowcast for Q4: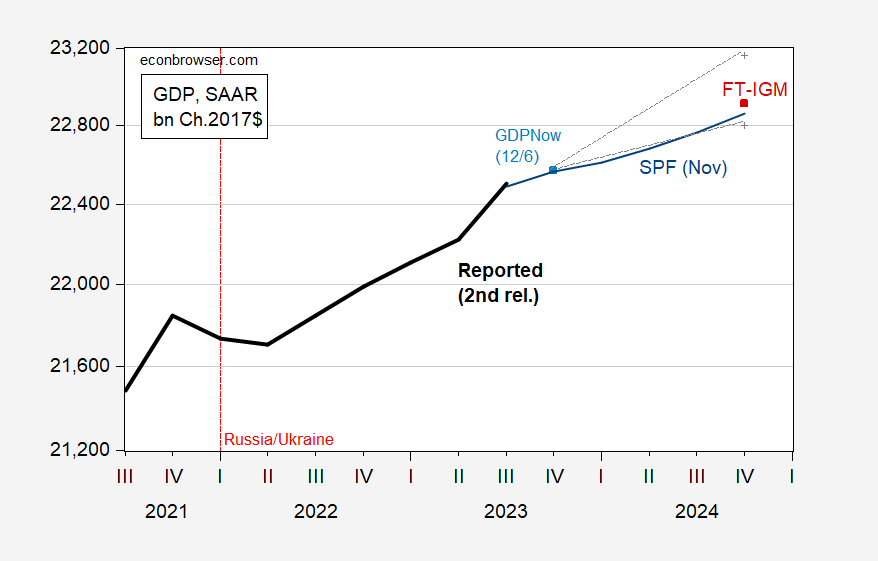 Figure 1: GDP (bold black), GDPNow estimate as of 12/6 (light blue square), FT-IGM 2024Q4 GDP (red square), 90%ile band (gray +), and November 2023 Survey of Professional Forecasters median (blue line). Source: BEA 2023Q3 2nd release, (12/6), , and . Median q4/q4 2024 growth forecast is 1.2%, compared to November SPF median of 1.3%.What’s anticipated Fed policy? This critically depends on expected inflation. Median survey response is 2.7% q4/q4 in 2024, compared to 2.4% from November SPF.
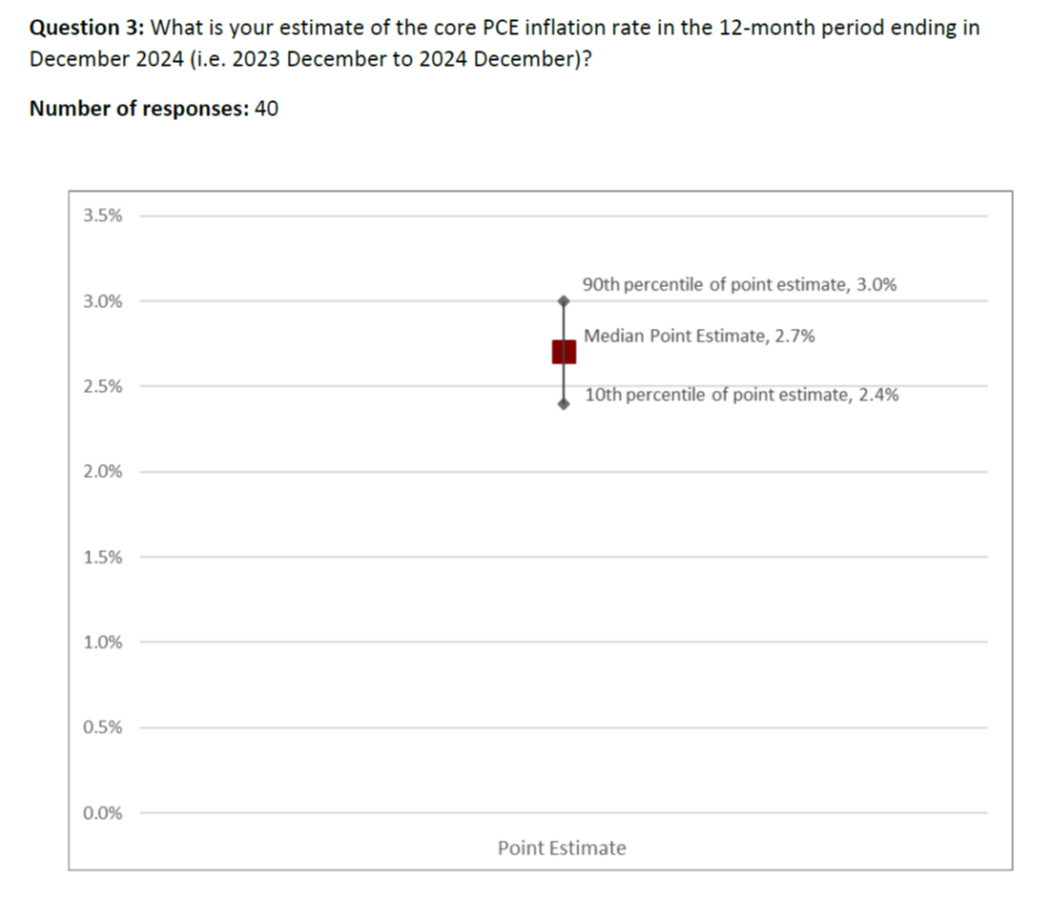 Source: .When do respondents think the Fed will start cutting rates? About 1/3 in 2024Q2, and 1/3 in 2024Q3. I predicted cuts in 2024Q2.
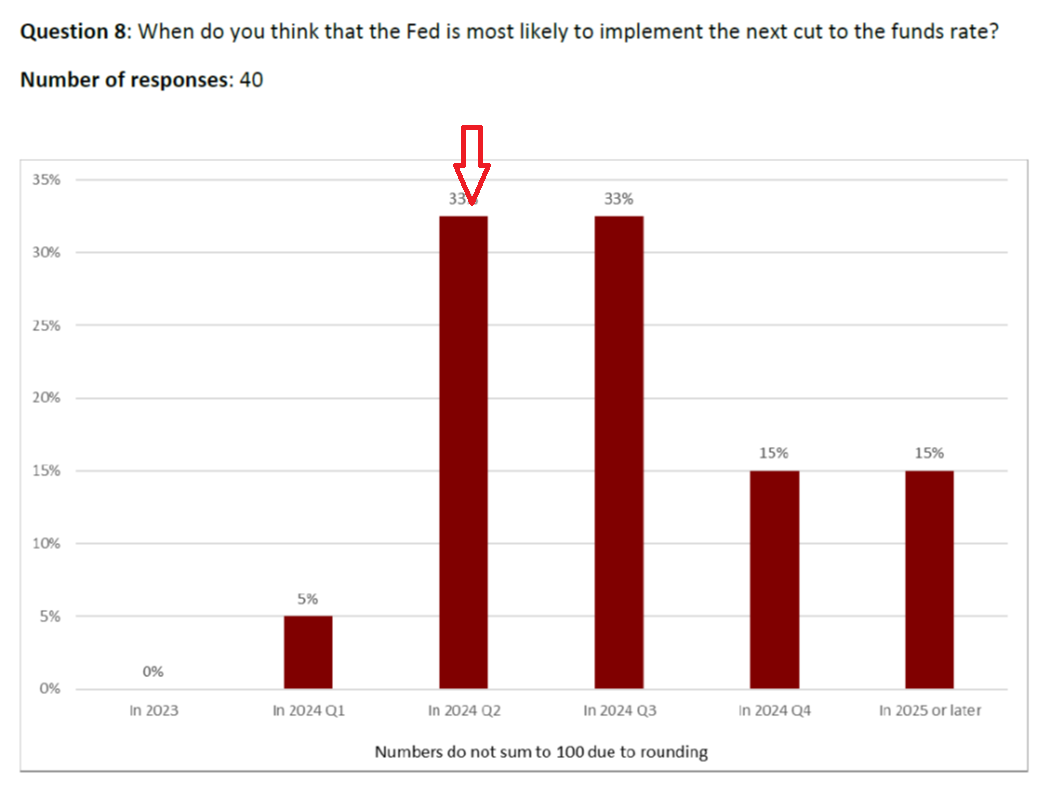 Notes: Red arrow at my response. Source: . My relatively early date for predicted Fed funds rate cuts is partly ascribable to my view that if a recession (as determined by NBER eventually) hits, it will hit in 2024Q1-Q2. Interestingly, as of today, indicates a greater than even probability of a rate decrease by end-March. The also indicates a drop in Q1.Why might rates be reduced more slowly than market anticipations. Jim is quoted in the :
“I still see a lot of momentum for the economy, so I don’t see a need for lowering rates right away, and I don’t think the Fed plans to do that either,” said James Hamilton, a professor of economics at the University of California in San Diego who participated in the survey.
What about the date for the beginning of a recession?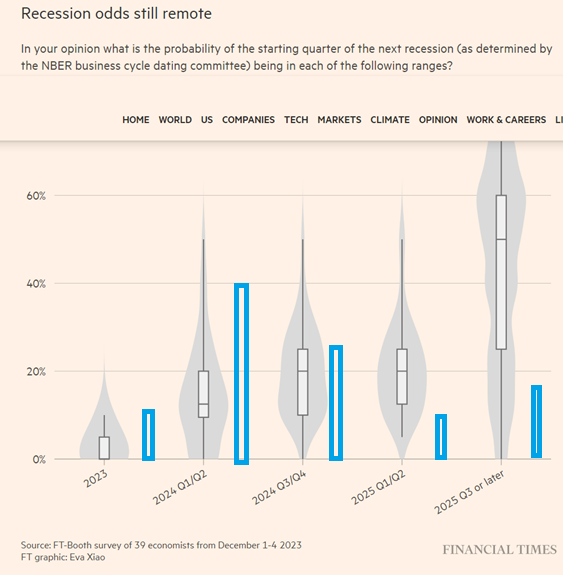 Notes: Blue bars are my response. Source: My view of recession likelihood is at variance with most others, where almost half of respondents do not view a recession as imminent. My interpretation is that even if we get a manage to “land the plane” (aka ) avoiding a deep downturn, we still might still get a recession, possibly mild (the 2001 recession always comes to my mind, wherein GDP essentially trended sideways, while unemployment rose about 1.5 percentage points from a low in 2000M09 to the NBER defined trough, and ultimately about 2.5 percentage points by 2003M06 (recall the jobless recovery?). That reading is based on historical correlations using domestic and foreign term spreads, and debt service ratio.
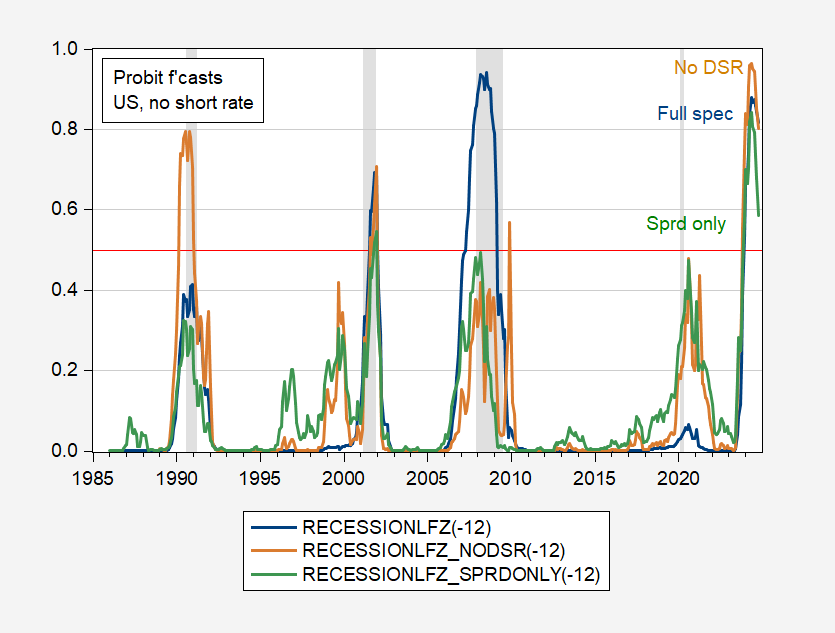 Figure 2: Recession probability forecasts, from term spread only specification (blue), term spread, national financial conditions index, foreign term spread (tan), and term spread, national financial conditions index, debt service ratio, foreign term spread (green). Debt service ratio 2023M04-09 extrapolated using 3 month Treasury yield, in first differences specification. Red dashed line at 50% threshold. NBER defined peak-to-trough recession dates shaded gray. Note that recession is defined here as a binary indicator. A high probability of recession does not necessarily correlate with a deep recession.More By This Author:Is Economic Activity Really A Lot Lower Than It Seems? Business Cycle Indicators Including Monthly GDPThe Foreign Born Labor Force
