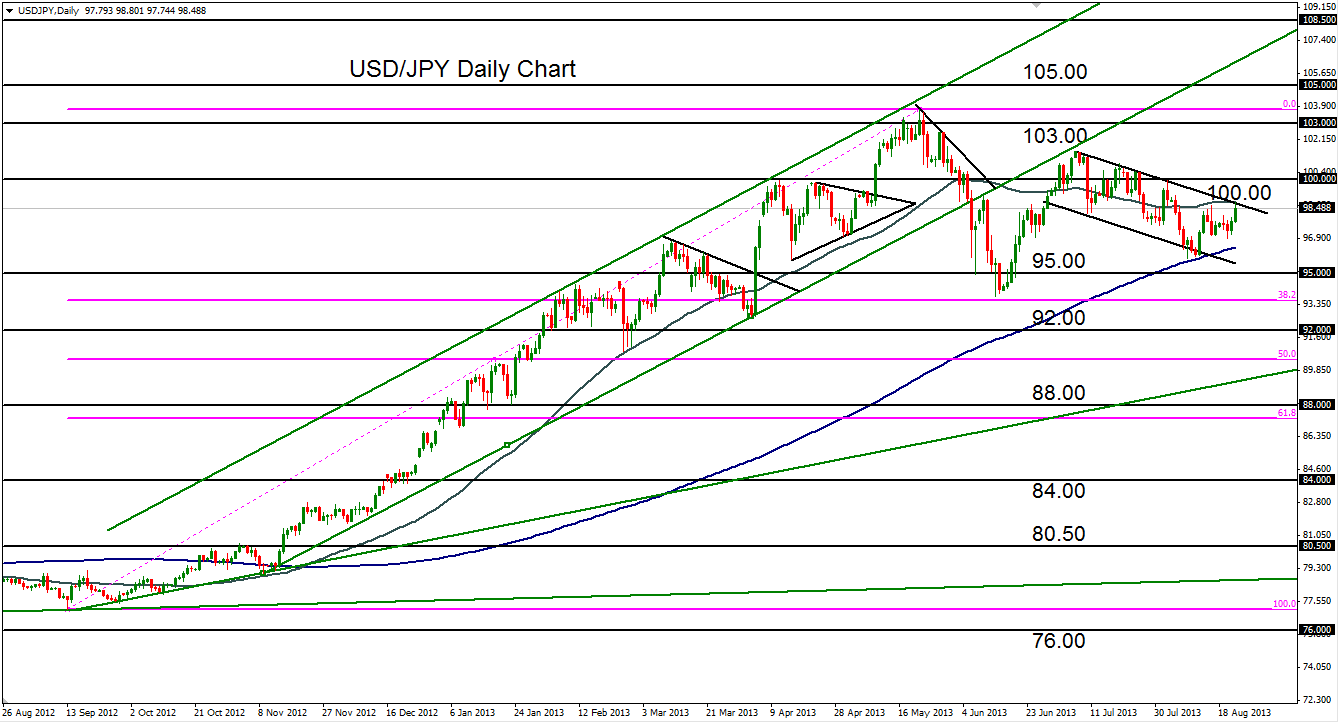

August 22, 2013 – USD/JPY (daily chart) has risen to the top of a descending channel that has been in place since early July. This channel resistance is reinforced by the 50-day moving average. For the past two and a half weeks, the currency pair has been trading between the 200-day moving average to the downside and the 50-day moving average to the upside. The current descending channel represents a consolidative correction within the bullish trend that has been in place since September 2012.
If price is able to break out above the current confluence of resistance (channel upper border and 50-day moving average), immediate resistance to the upside resides around the important 100.00 level. A further breakout above 100.00 could prompt the pair to reach back up towards the 103.00-area highs once again. The 200-day moving average should continue to serve as strong support within a continuing bullish trend.
James Chen, CMT
Chief Technical Strategist
City Index Group
Forex trading involves a substantial risk of loss and is not suitable for all investors. This information is being provided only for general market commentary and does not constitute investment trading advice. These materials are not intended as an offer or solicitation with respect to the purchase or sale of any financial instrument and should not be used as the basis for any investment decision.


