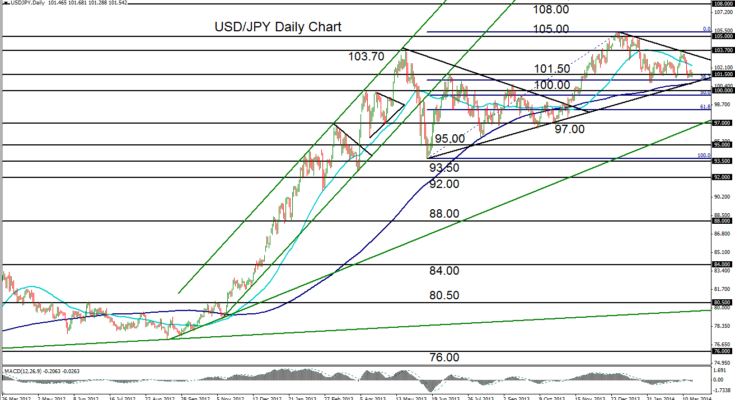
March 19, 2014 – USD/JPY (daily chart) continues to consolidate indecisively between its 50-day and 200-day moving averages, unable to make any significant gains as it fluctuates near its year-to-date lows. Early March saw the currency pair rise swiftly to key resistance around 103.75, only to drop just as quickly to its current position just above the 2014 low of 100.75.
Now consolidating above this support level, the pair is also directly above other key technical support factors. These support factors include: the noted 200-day moving average, an uptrend support line extending back to the June 2013 low, and the 38% Fibonacci retracement level of the last major bullish trend.
If the pair is able to stay above this strong support, another rebound to the upside could likely be in order. A break above the 50-day moving average should once again target the 103.75 resistance level, followed by the 105.00 level. Any subsequent move above December’s five-year high of 105.43 would confirm a continuation of the longstanding bullish trend and could potentially begin to target further upside around the 108.00 resistance level.
James Chen, CMT
Chief Technical Strategist
City Index Group
Forex trading involves a substantial risk of loss and is not suitable for all investors. This information is being provided only for general market commentary and does not constitute investment trading advice. These materials are not intended as an offer or solicitation with respect to the purchase or sale of any financial instrument and should not be used as the basis for any investment decision.


