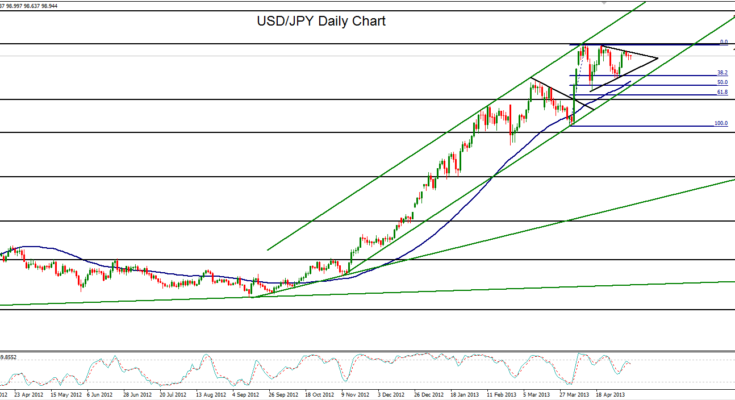
May 9, 2013 – USD/JPY (daily chart) has consolidated within a pennant pattern just under the 100.00-area highs. This pattern generally has a bullish breakout bias, especially as it occurs during the course of a strong and steep uptrend that has been in place for the past seven months. The pennant represents a correction and consolidation after the long-term high just shy of the 100.00 target was established about a month ago and then re-tested just about a week after that. A breakout above the pennant would place price very close to those highs once again for yet another attempt at rising above 100.00. A breakout above 100.00 would confirm a bullish trend continuation with a further upside objective around the 103.00 resistance area.
James Chen, CMT
Chief Technical Strategist
City Index Group
Forex trading involves a substantial risk of loss and is not suitable for all investors. This information is being provided only for general market commentary and does not constitute investment trading advice. These materials are not intended as an offer or solicitation with respect to the purchase or sale of any financial instrument and should not be used as the basis for any investment decision.


