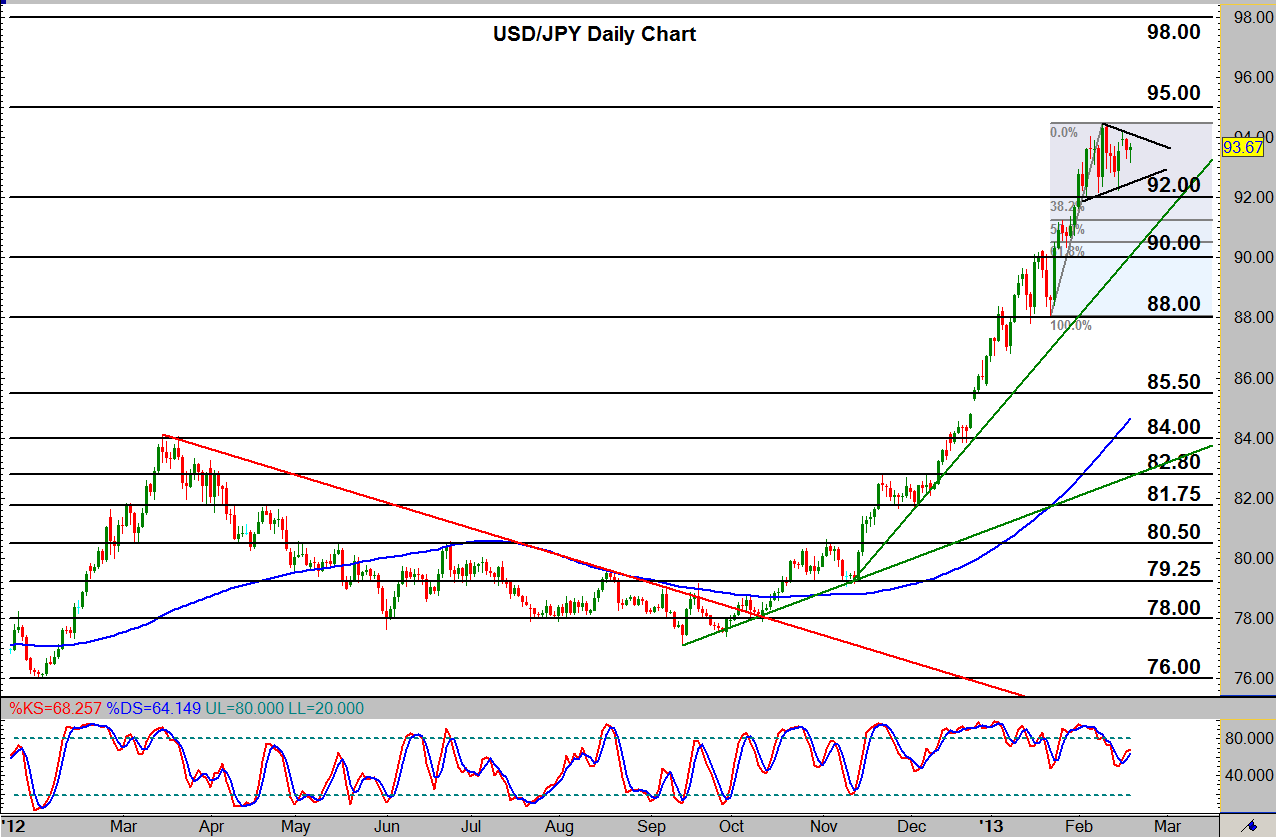

USD/JPY (daily chart) as of February 20, 2013 has formed a bullish pennant/triangle pattern in the midst of a strong, continued uptrend. This consolidation pattern occurs after price hit its 33-month high of 94.44 early last week. The bullish chart pattern that has been formed since then is a common pullback formation with converging borders. The key event to watch for with these types of potential bullish continuation patterns would be a breakout above the upper border, in which case the upside price objective would reside first around the 95.00 resistance level, and then towards 98.00 resistance. Further to the upside, an extension of the height of the pennant’s flagpole on a potential pattern breakout resides in the vicinity of the 100.00 price region. Downside support within the steep and continuing uptrend resides around the 92.00 price level, which is around a key 38.2% Fibonacci retracement of the last major bullish run.
James Chen, CMT
Chief Technical Strategist
City Index Group
Forex trading involves a substantial risk of loss and is not suitable for all investors. This information is being provided only for general market commentary and does not constitute investment trading advice. These materials are not intended as an offer or solicitation with respect to the purchase or sale of any financial instrument and should not be used as the basis for any investment decision.


