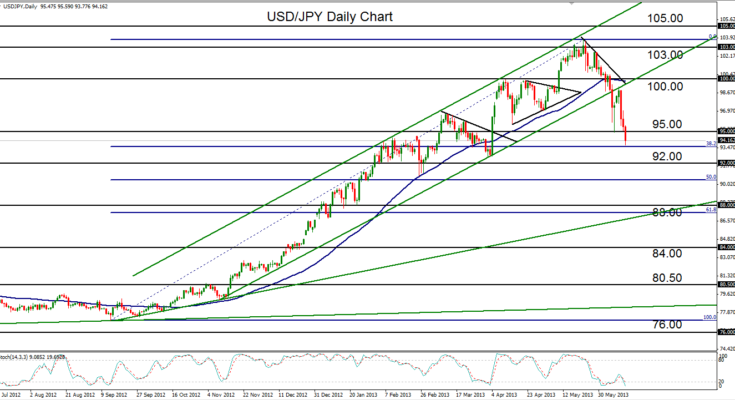
June 13, 2013 – USD/JPY (daily chart) has extended its decline of the past three weeks by breaking down below key support around the 95.00 area. Although the current downside correction has constituted the greatest percentage decline since the bullish trend began nine months ago, price has only fallen enough to hit the 38.2% Fibonacci retracement of the uptrend from its September 2012 low at 77.11 to its May high at 103.72. Therefore, within the context of the overall trend, the current bearish correction can still be considered a relatively shallow one at the present time. Further downside price moves, however, could quickly change this situation. The next major support levels to the downside include 92.00 and as far down as 88.00. A strong bounce around the current level or one of the lower retracement levels, however, could see a recovery back up at least towards the 100.00 level.
James Chen, CMT
Chief Technical Strategist
City Index Group
Forex trading involves a substantial risk of loss and is not suitable for all investors. This information is being provided only for general market commentary and does not constitute investment trading advice. These materials are not intended as an offer or solicitation with respect to the purchase or sale of any financial instrument and should not be used as the basis for any investment decision.


