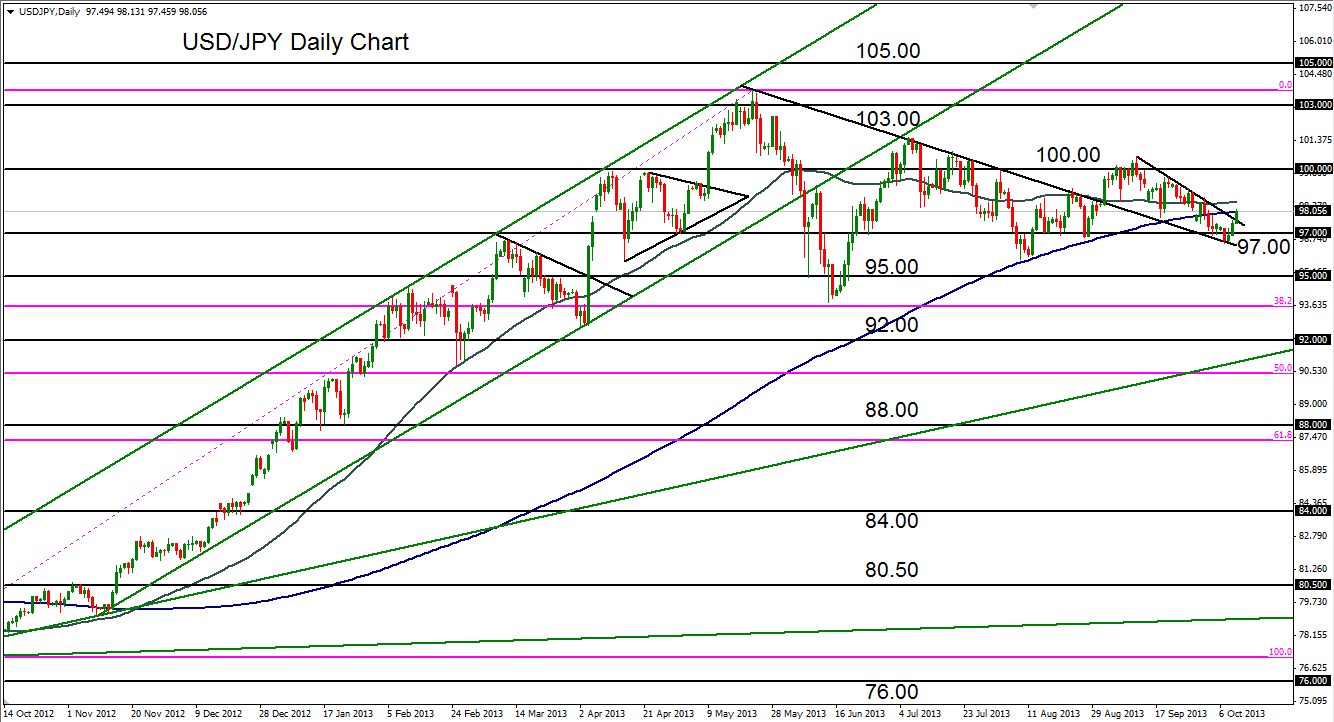

October 10, 2013 – USD/JPY (daily chart) has advanced to break out tentatively above a falling wedge pattern consolidation that has been in place since the 100.60 high in mid-September. This pattern, in turn, is the latest component of a prolonged sideways trading range that has been in place for the past four months, after the multi-year high of 103.72 was established in May. Early this week, price dipped below support at 97.00, but has since recovered in its current advance. In making the tentative breakout above the wedge pattern, the pair has also reached back up to the 200-day moving average after having recently dropped below it for the first time since November 2012. If the pair can stay above 97.00 and sustain the upside momentum off the current advance, the key upside objectives remain at the 100.00 psychological level followed by the 103.00 region, both within the current trading range.
James Chen, CMT
Chief Technical Strategist
City Index Group
Forex trading involves a substantial risk of loss and is not suitable for all investors. This information is being provided only for general market commentary and does not constitute investment trading advice. These materials are not intended as an offer or solicitation with respect to the purchase or sale of any financial instrument and should not be used as the basis for any investment decision.


