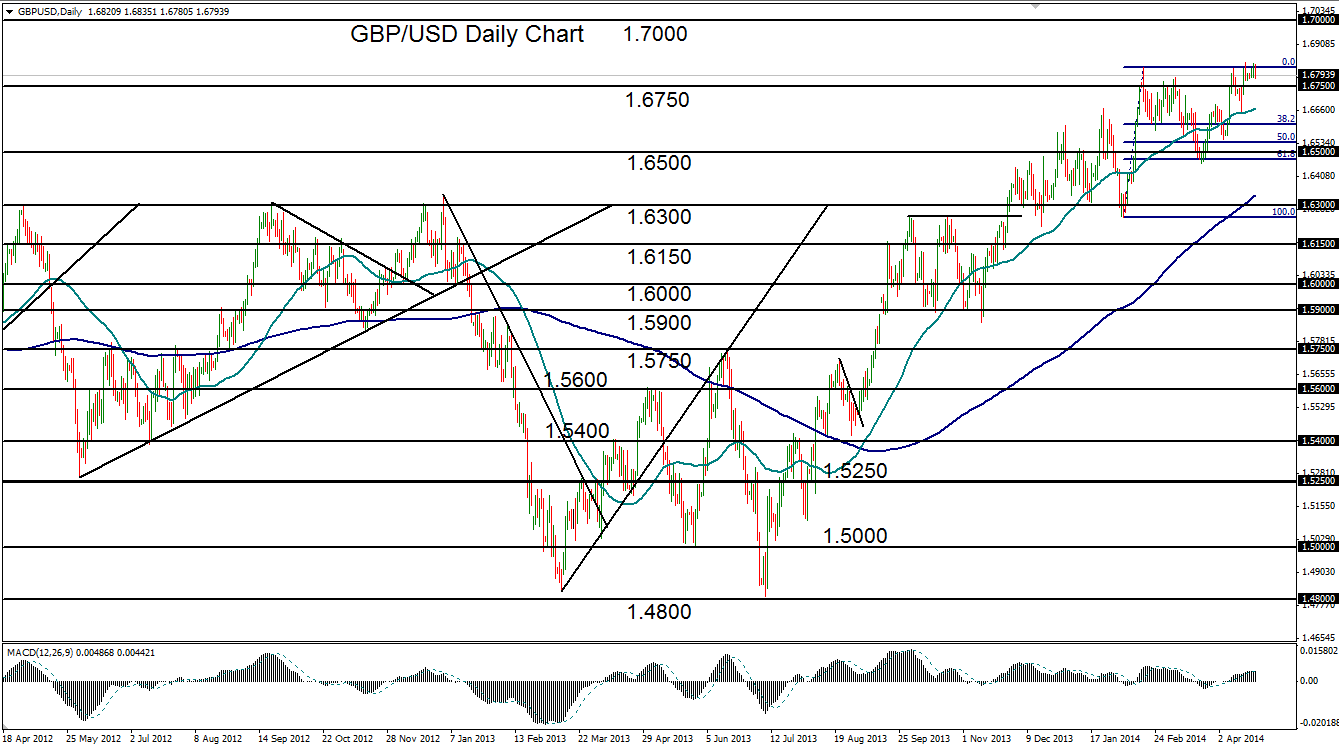

April 23, 2014 – GBP/USD (daily chart) is currently trading just off its four-year high of 1.6840 that was established late last week. From the beginning of the current bullish trend in July of 2013 around the 1.4800 double-bottom low, the currency pair has risen by over 13% in only nine months. Throughout the course of this strong bullish trend, the pair has made only relatively minor dips, displaying a remarkably sharp upward trajectory. This trajectory is highlighted by the fact that price action has consistently traded and recovered well above both its rising 200-day and 50-day moving averages.
Currently consolidating very close to last week’s long-term high, which exceeded February’s 1.6821 high by just around 20 points, GBP/USD is on track to continue its bullish trend after another potential pullback. Short-term support on this potential pullback resides around the 1.6650 level, where it pulled back to the 50-day moving average early last week. To the upside, a continuation of the sharp uptrend should look next to target the 1.7000 level, last reached in August of 2009.
James Chen, CMT
Chief Technical Strategist
City Index Group
Forex trading involves a substantial risk of loss and is not suitable for all investors. This information is being provided only for general market commentary and does not constitute investment trading advice. These materials are not intended as an offer or solicitation with respect to the purchase or sale of any financial instrument and should not be used as the basis for any investment decision.


