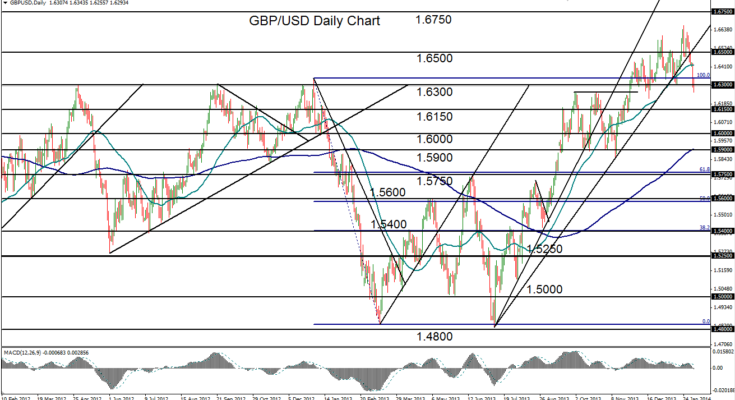
February 4, 2014 – GBP/USD (daily chart) has been in a sharp decline for the past week-and-a-half after hitting a 2 ½ year high of 1.6667 in late January. That high broke the previous long-term high of 1.6602 that was established in the very beginning of the year. The recent plunge has brought the currency pair down by almost 2.5% from its high thus far, in a pullback that has swiftly broken down below both its 50-day moving average as well as an uptrend line extending back to the July 2013 1.4800-area low. This has significantly disrupted the steep bullish trend that had been in place for the past six months.
Currently, the pullback has prompted the pair to dip, but not yet make a daily close, below its pivotal support level around 1.6300. Any further downside momentum on this potential breakdown of support could prompt a return back down to further downside support levels at 1.6150 and then 1.5900, where the 200-day moving average is currently situated. A turn back to the upside from around the current support could further extend the recent trading range, with an upside resistance target around the 1.6600-area long-term highs.
James Chen, CMT
Chief Technical Strategist
City Index Group
Forex trading involves a substantial risk of loss and is not suitable for all investors. This information is being provided only for general market commentary and does not constitute investment trading advice. These materials are not intended as an offer or solicitation with respect to the purchase or sale of any financial instrument and should not be used as the basis for any investment decision.


