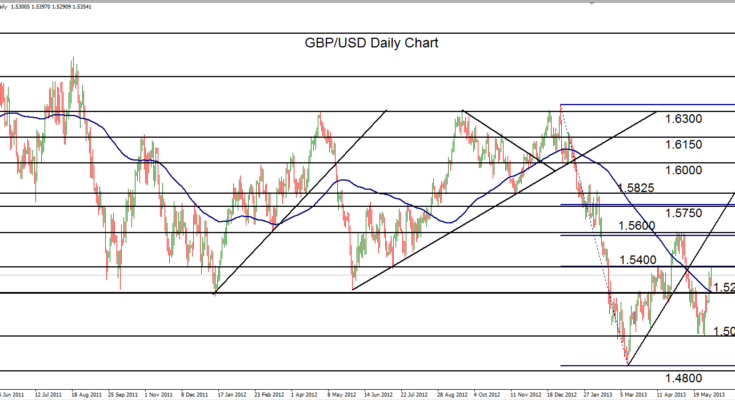
June 5, 2013 – GBP/USD (daily chart) has risen in its bullish correction of the past week to hit key resistance around the 1.5400 level, which is also right at the 38.2% Fibonacci retracement of the steep decline from the 1.6340 area in the very beginning of the year down to the 1.4830 area in mid-March. This bullish correction launched off a double-bottoming pattern around the major 1.5000 level last week, and rose to break out above the 1.5250 prior resistance area, which was also around the 100-day moving average.
If the current 1.5400 level is able to hold, thereby halting or stalling the bullish correction, a rough head-and-shoulders pattern will have been formed. This event would hint at further downside towards 1.4800 and lower, continuing the entrenched bearish trend. If 1.5400 is unable to hold, further key upside resistance resides around the solid 1.5600 resistance level, which was last reached in early May and which coincides with the important 50% Fib retracement.
James Chen, CMT
Chief Technical Strategist
City Index Group
Forex trading involves a substantial risk of loss and is not suitable for all investors. This information is being provided only for general market commentary and does not constitute investment trading advice. These materials are not intended as an offer or solicitation with respect to the purchase or sale of any financial instrument and should not be used as the basis for any investment decision.


