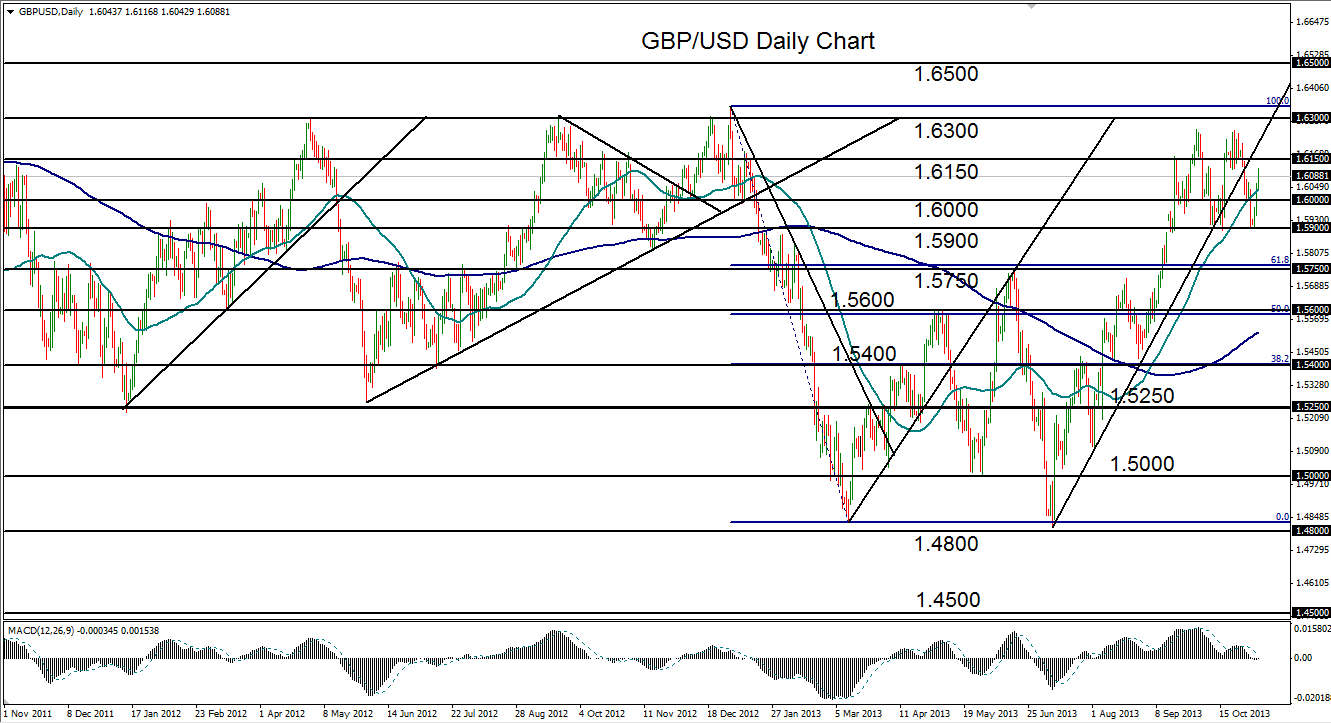

November 6, 2013 – GBP/USD (daily chart) has rebounded from a double bottom formation around the 1.5900 support level. This occurs within a month-long consolidation after the pair trended up from July to hit a 9-month high at 1.6259 in early October. After that high was reached, which was just short of major resistance at 1.6300, both a double top pattern and a double bottom pattern have formed within a well-defined trading range approximately between 1.5900 support and 1.6250 resistance.
Having just hammered out the double bottom around 1.5900 earlier this week, the pair has rebounded towards a potential re-test of the 1.6250 double top. Before it may potentially reach that level, the pair should bump up against intermediate resistance around 1.6150. In the event of a breakout above both 1.6150 and the 1.6250 double top resistance, price will have confirmed a continuation of the 4-month uptrend and could then reach for further upside targets around the noted 1.6300 major resistance and then 1.6500. Any breakdown below the 1.5900-area double bottom should find key support further to the downside around 1.5750.
James Chen, CMT
Chief Technical Strategist
City Index Group
Forex trading involves a substantial risk of loss and is not suitable for all investors. This information is being provided only for general market commentary and does not constitute investment trading advice. These materials are not intended as an offer or solicitation with respect to the purchase or sale of any financial instrument and should not be used as the basis for any investment decision.


