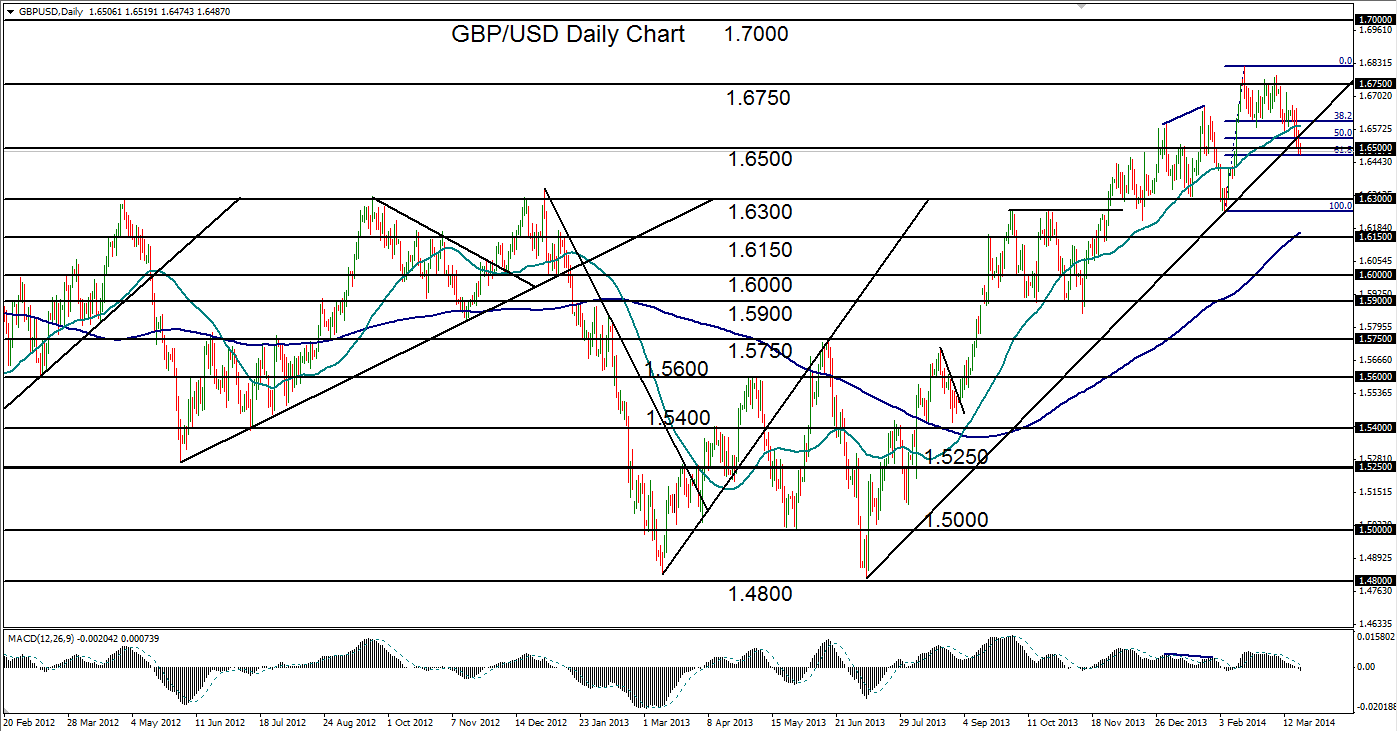

March 21, 2014 – GBP/USD (daily chart) has approached a full week of general decline that has brought the currency pair down well below its 50-day moving average. Current price action reached a low slightly below the key 1.6500 level to hit the 61.8% Fibonacci retracement of the last major bullish run, which ran from early February’s 1.6250 low up to mid-February’s four-year high at 1.6821. The pair has also dipped slightly below a major bullish trend line that extends back to the 1.4800-area double-bottom low in July of 2013.
The current bearishness in GBP/USD could be a precursor of further decline that could break down the steep uptrend that has been in place for the past eight months, which culminated in February’s noted four-year high. Now sitting atop key support, the currency pair is currently at a critical juncture. Further declines would be indicated on a convincing breakdown below this support area – around the 1.6475 level – which could then lead the way to a drop towards further key support around 1.6300. A drop of this magnitude should indicate a potential breakdown of the eight-month bullish trend.
James Chen, CMT
Chief Technical Strategist
City Index Group
Forex trading involves a substantial risk of loss and is not suitable for all investors. This information is being provided only for general market commentary and does not constitute investment trading advice. These materials are not intended as an offer or solicitation with respect to the purchase or sale of any financial instrument and should not be used as the basis for any investment decision.


