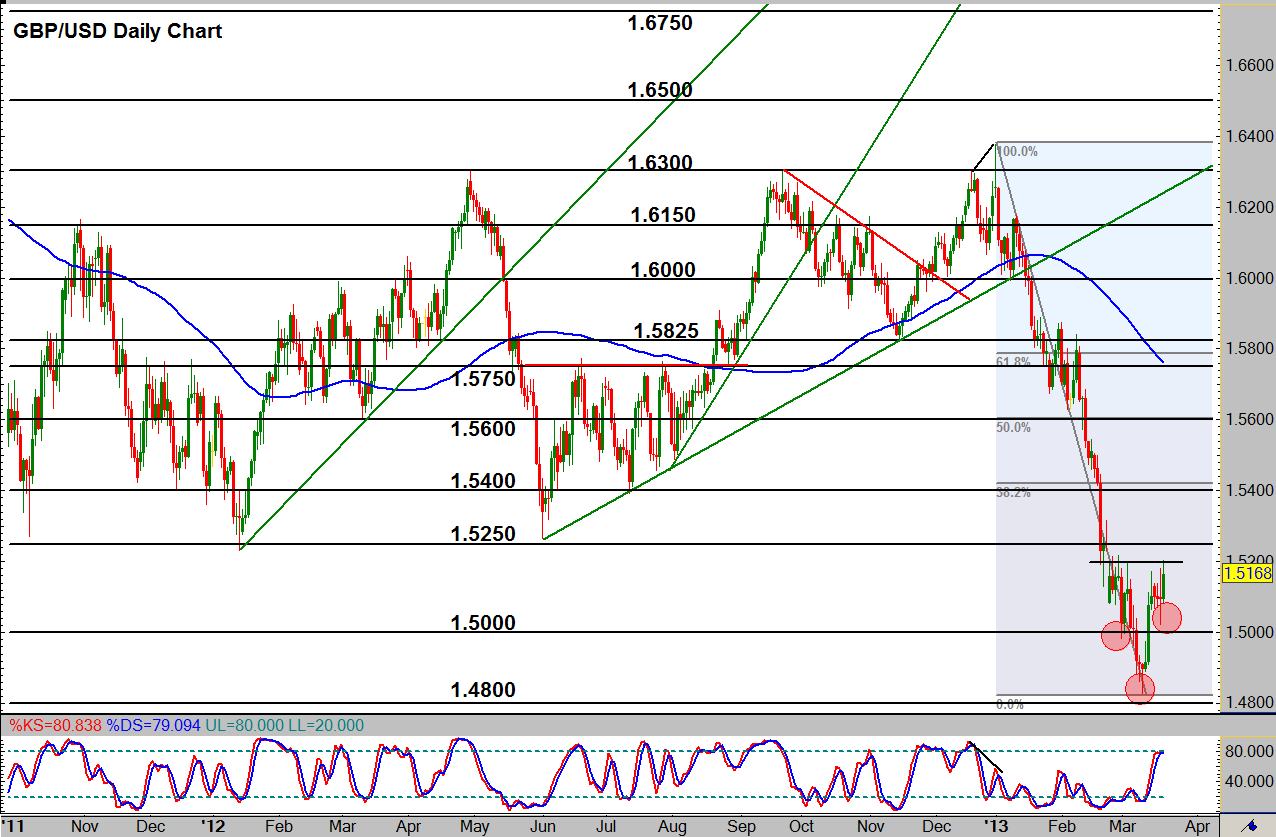

GBP/USD (daily chart) as of March 21, 2013 has settled into a potential bullish correction/reversal pattern in an inverted head and shoulders formation. While these types of patterns are often expected to reverse trends, they can also serve as indicators of potential corrections in a trend without the complete reversal. The current head and shoulders pattern may be just such an indication. The left shoulder in the beginning of March is at 1.4985, the head in mid-March is at 1.4830 (with a hammer candle reversal pattern), and the right shoulder just yesterday is at 1.5025. Within this pattern, the neckline breakout trigger is around the 1.5200 level.
With a neckline breakout, major resistance resides nearby in the 1.5250 area. Further to the upside is the key 1.5400 resistance objective, also around the 38.2% retracement of the downtrend from the 1.6376 high in January to the 1.4830 low in March. If the expected head and shoulders price target is to be reached, the low of the pattern at the head measured to the high of the pattern at the neckline can be projected to the upside towards the 1.5600 area, with is also the the key 50% trend retracement.
James Chen, CMT
Chief Technical Strategist
City Index Group
Forex trading involves a substantial risk of loss and is not suitable for all investors. This information is being provided only for general market commentary and does not constitute investment trading advice. These materials are not intended as an offer or solicitation with respect to the purchase or sale of any financial instrument and should not be used as the basis for any investment decision.


