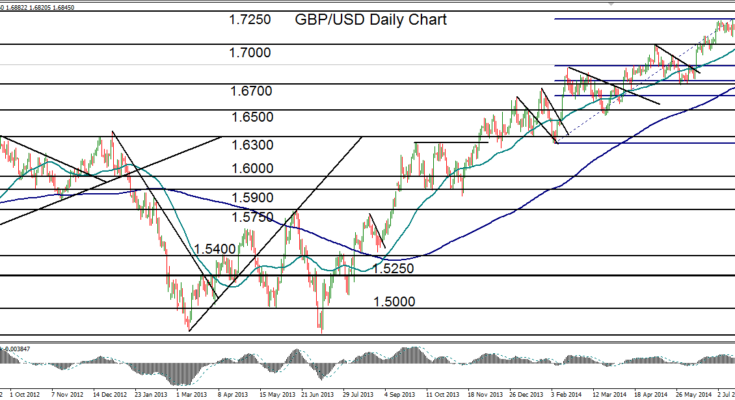
August 6, 2014 – GBP/USD (daily chart) has continued to extend its declines from the multi-year high of 1.7190 that was hit just three weeks ago, in mid-July. After that high was established, which was just short of its original 1.7250 upside target, the currency pair reversed course to make a sharp decline. That decline broke down swiftly below the key 1.7000 support level and the 50-day moving average in late July.
GBP/USD is currently trading squarely between its 50-day and 200-day moving averages, which are both still pointing up and indicating a solid bullish trend for the time being. At the moment, the recent drop can still be considered simply a pullback within the context of a strong, year-long uptrend.
The simple pullback could turn into a more substantial bearish move if the currency pair is able to break below major support around the 1.6700 level. This level is not only a key support/resistance factor, it is also where the 200-day moving average currently resides, as well as a key 50% Fibonacci retracement level.
Any breakdown below 1.6700 could signal a major correction, with further downside support around the 1.6500 and 1.6300 levels.
To the upside, a recovery of the current pullback would be indicated on a re-emergence above 1.7000, in which case the 1.7250 level continues to stand as the key upside target in a continuation of the longstanding bullish trend.
James Chen, CMT
Chief Technical Strategist
City Index Group
Forex trading involves a substantial risk of loss and is not suitable for all investors. This information is being provided only for general market commentary and does not constitute investment trading advice. These materials are not intended as an offer or solicitation with respect to the purchase or sale of any financial instrument and should not be used as the basis for any investment decision.


