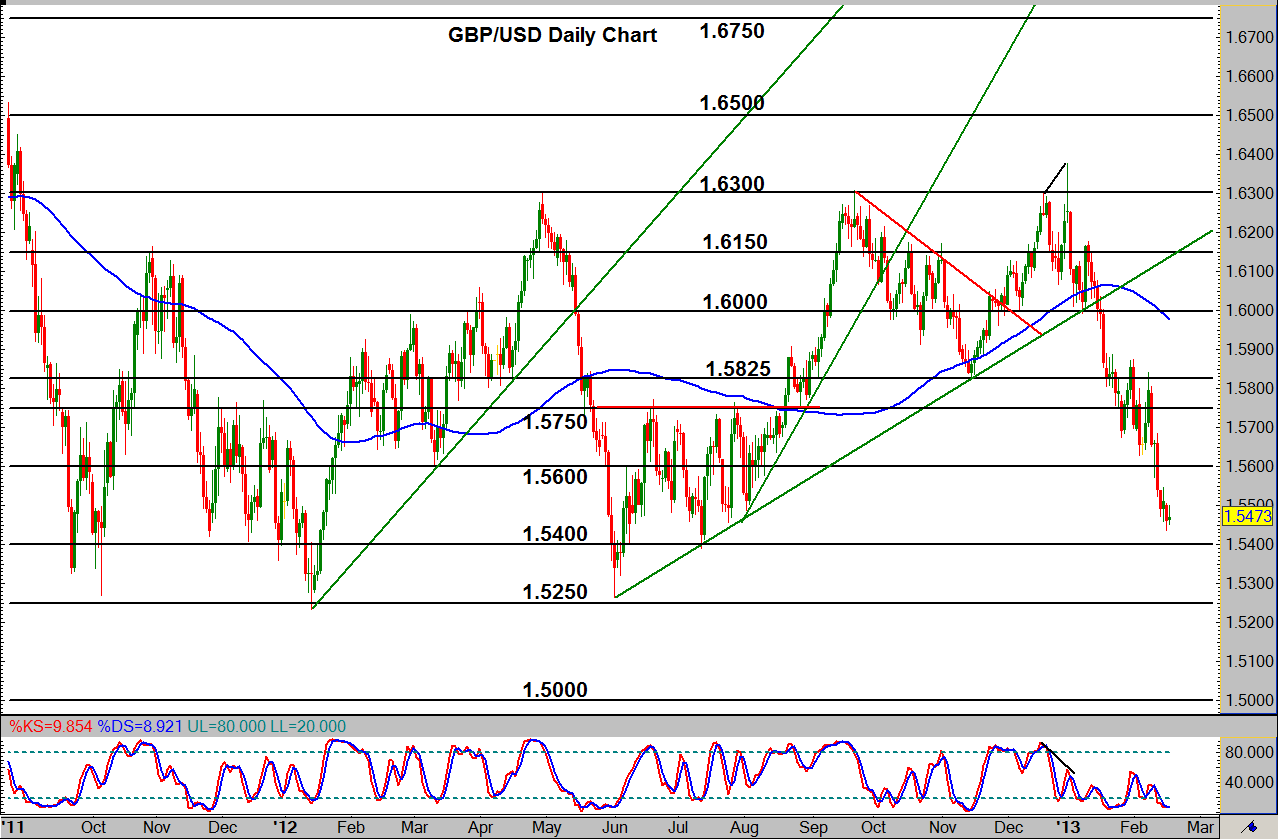

GBP/USD (daily chart) as of February 19, 2013, having established a new 7-month low yesterday, has sustained the strong bearish trend that has been in place since the drop from 1.6300 resistance in the very beginning of the year. After making a pivotal breakdown in mid-January below the key 1.6000 level and an important bullish support trend line extending back to the June 2012 1.5266 low, price dropped further to breakdown below successively lower support levels. On the longer-term weekly chart, this downside move can be seen as a significant breakdown below a large triangle pattern, which highlights the magnitude of the current bearish trend.
The most recent support breakdown occurred mid-week last week on a breach below 1.5600, with a downside objective around 1.5400 support. Currently, price has approached this support level. A further breakdown below the 1.5400 level could potentially move towards further support around the 1.5250 area long-term lows. Yet a further downside price objective on a continuation of the bearish trend resides around the important 1.5000 region, a level not reached since mid-2010.
James Chen, CMT
Chief Technical Strategist
City Index Group
Forex trading involves a substantial risk of loss and is not suitable for all investors. This information is being provided only for general market commentary and does not constitute investment trading advice. These materials are not intended as an offer or solicitation with respect to the purchase or sale of any financial instrument and should not be used as the basis for any investment decision.


