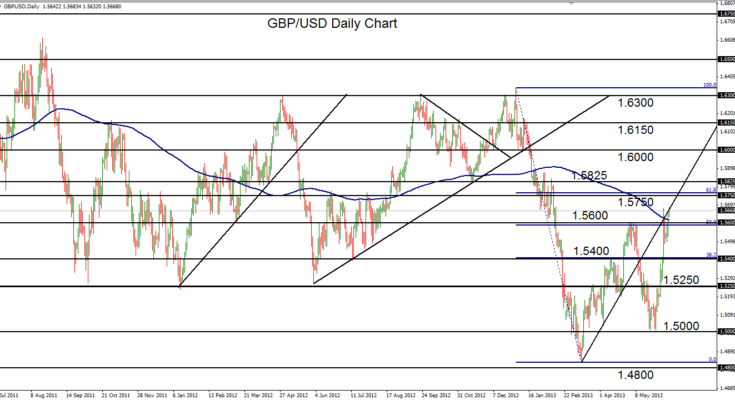
June 12, 2013 – GBP/USD (daily chart) has continued its upside march above previous 1.5600 resistance, continuing the sharp bullish recovery that began from the double-bottom low near 1.5000 in late May. This recent bullishness has now recovered more than 50% of the dramatic losses the pair experienced from the high at the very beginning of the year (around 1.6340) down to the mid-March low (around 1.4830). Price has also reached the underside of a key uptrend line extending back to the noted mid-March 1.4830 low, and moved slightly above the 200-day moving average. Currently, GBP/USD is moving up towards the 1.5750 resistance area and the 61.8% Fibonacci retracement of the noted plunge from the beginning of the year to mid-March. The pair could see some further upside and recovery around these resistance areas, and possibly higher, before potentially resuming its bearish stance with a turn back to the downside towards the 1.5000 handle and lower.
James Chen, CMT
Chief Technical Strategist
City Index Group
Forex trading involves a substantial risk of loss and is not suitable for all investors. This information is being provided only for general market commentary and does not constitute investment trading advice. These materials are not intended as an offer or solicitation with respect to the purchase or sale of any financial instrument and should not be used as the basis for any investment decision.


