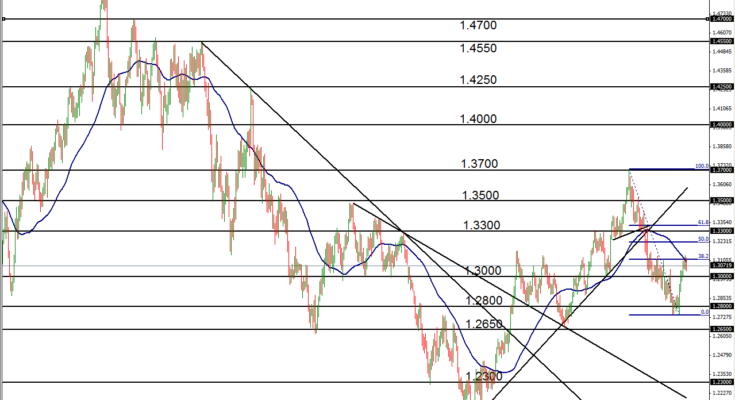
EUR/USD (daily chart) as of April 12, 2013 has stalled its climb of the past week around the 38.2% Fibonacci retracement level of the two-month bearish trend from early February to early April. This bullish correction reached a high yesterday around the 1.3138 level before stalling its climb. Not only is this price resistance area around the key 38.2% Fibonacci level, it is also in the region of the 50-day moving average.
Having bumped up against this tentative resistance, EUR/USD may be exhausting its rally. A breakdown below the key 1.3000 level would provide some confirmation of this exhaustion, and an indication that price could be looking towards a resumption of the bearish bias that has been in place since the beginning of February. In this event, a key downside objective remains around the 1.2650 level. A breakout above yesterday’s high could extend the current bullish correction towards 1.3300 resistance.
James Chen, CMT
Chief Technical Strategist
City Index Group
Forex trading involves a substantial risk of loss and is not suitable for all investors. This information is being provided only for general market commentary and does not constitute investment trading advice. These materials are not intended as an offer or solicitation with respect to the purchase or sale of any financial instrument and should not be used as the basis for any investment decision.


