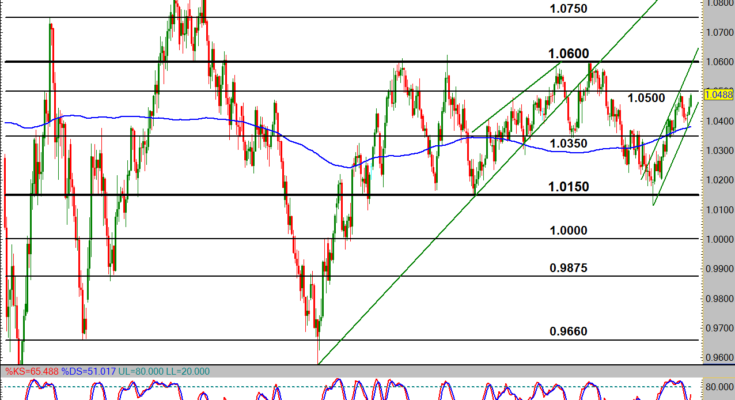
AUD/USD (daily chart) as of April 3, 2013 has resumed its bullish range move to reach for a retest of last week’s two-month high just shy of 1.0500 resistance. The dip that occurred during the latter half of last week pulled back to around the 200-day moving average support, hitting a low at 1.0384 with a hammer candle before recovering during the first half of the current trading week.
This occurs within a steep bullish trend channel extending back to the key 1.0150 support area, which occurs within the larger context of a solid trading range between 1.0150 support and 1.0600 resistance that has been in place for the past nine months.
In order for price to fulfill its long-standing trading range, a breakout above 1.0500 would have a clear objective around the top of the range, in the 1.0600 resistance region. Key support within this range play currently resides around the 1.0350 price area.
James Chen, CMT
Chief Technical Strategist
City Index Group
Forex trading involves a substantial risk of loss and is not suitable for all investors. This information is being provided only for general market commentary and does not constitute investment trading advice. These materials are not intended as an offer or solicitation with respect to the purchase or sale of any financial instrument and should not be used as the basis for any investment decision.


