
The BLS Job Openings and Labor Turnover Survey (JOLTS) can be used as a predictor of future jobs growth, and the predictive elements show that the jobs situation growth rate is mixed. This was an annual revision month which negates past analysis.

- the number of seasonally adjusted PRIVATE jobs openings – which is the most predictive of the JOLTS elements – growth decelerated 1.0% from last month, and up 5.3% (versus a revised 6.3% from last month) from one year ago. The seasonally adjusted jobs opening rate (percent of job openings compared to size of workforce) was up 0.2 to 2.9%. Overall, the data is mixed – but there may be a marginal improvement in jobs growth.
- Unadjusted PRIVATE hires year-over-year growth decelerated 1.5% month-over-month and PRIVATE separations accelerated 0.5% month-over-month – in theory meaning the employment situation is marginally worse. However, this portion of the JOLTS report has shown little predictive ability.
- The market expected seasonally adjusted jobs openings at 3.974 M to 4.030 M (consensus 4.000 M) versus the headline 4.173M
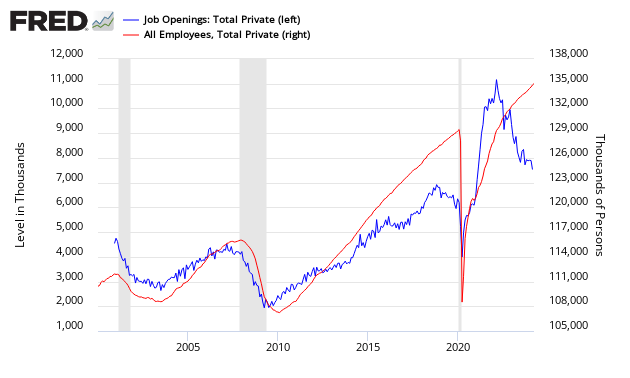
The relevance of JOLTS to future employment is obvious from the graphic below which shows JOLTS Job Openings leading or coincident to private non-farm employment. JOLTS job openings are a good predictor of jobs growth turning points.
Adjusted Private Jobs Openings from JOLTS (blue line, left axis) compared to BLS Non-farm Private (red line, right axis)
The graph below uses year-over year growth comparisons of non-seasonally adjusted non-farm private BLS data versus JOLTS Job Openings – and then compare trend lines. JOLTS is suggesting that the rate of improvement the jobs situation will not change (either for the worse or for the better).
Year-over-Year Change – Seasonally Jobs Openings from JOLTS (blue line, left axis) compared to Unadjusted BLS Non-farm Private (red line, right axis)

The JOLTS Unadjusted Private hires rate (percent of separations compared to size of workforce) was unchanged at 3.7 – and the separations rate (percent of separations compared to size of workforce) was unchanged at 3.2. Separations are the workforce which quit or was laid off. Likewise, hires are the workforce hired.
