The following is a partial summary of the conclusions from the fxempire.com weekly analysts’ meeting in which we cover outlooks for the major pairs for the coming week and beyond.
Summary
- Technical Outlook: Near term bullish, medium term neutral. As suspected we indeed got our “sell the rumor buy the news†bounce after the ECB fully met but did not exceed expectations. Odds favor some follow through higher to test likely resistance levels this week.
- The big technical question: With bearish uncertainty about ECB easing gone, will the pair resume its usual tracking of risk appetite as portrayed by the S&P 500 and other leading Western indexes?
- Fundamental Outlook: Summary of ramifications of the ECB’s package, what it meant and what it didn’t, and whether this and other fundamentals support a bounce
- Trader Positioning: The bearish and bullish
- Â
EURUSD Weekly Technical Outlook: Â Bullish As Strong Support Withstands ECB Easing, Odds (And Fundamentals) Favor Bullish Bounce

EURUSD Weekly Technical, Fundamental Forecast June 8, 2014: Huge Lessons, And Coming QE-EU?
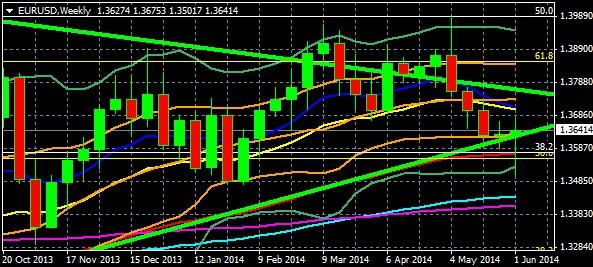
EURUSD Weekly Chart October 20, 2013 to Present
KEY: 10 Week EMA Dark Blue, 20 WEEK EMA Yellow, 50 WEEK EMA Red, 100 WEEK EMA Light Blue, 200 WEEK EMA Violet, DOUBLE BOLLINGER BANDS: Normal 2 Standard Deviations Green, 1 Standard Deviation Orange. Green downtrend line from EURUSD peak of July 2008 to present, green uptrend line from August 2012 to present.
Source: MetaQuotes Software Corp, www.fxempire.com, www.thesensibleguidetoforex.com
01 Jun. 07 22.27
Key Take-Aways Weekly Chart: Likely Trading Range This Week
As the weekly chart above shows, strong support held through the worst the ECB could throw at it. This support is buttressed by five layers of converging support:
- –The round 1.355 figure itself
- –The green uptrend line dating from mid-2012
- –The 50% Fibonacci retracement of the downtrend from mid-2011 to mid-2012.
- –The 38.2% Fibonacci retracement of the bigger downtrend from July 2008 to June 2010
- –Most importantly, the psychologically critical 50 week (aka 200 day) EMA in the 1.355 zone. For many medium and longer term traders, when something breaks below its 200 day moving average, that’s the time to exit longs and open short positions.
The pair managed to stabilize, and even close slightly higher for the week at 1.3643. Given the failed deep probe of lower support and fundamental outlook described below, the odds favor some follow through to test higher towards the next major resistance around 1.37 area comprised of the following elements:
- The psychologically significant round number of 1.37 area itself, which is the high close of the past 3 weeks.
- Convergence of both 10 and 20 week EMAs.
A confirmed break beyond that level opens the door for a test of the long term downtrend line around 1.376.
Thus the week’s range is likely within the 1.364 to 1.376 area.
Likely Trading Range For Coming Weeks
Looking beyond the coming days, the pair remains in its 17 week trading range, within its double Bollinger ® band neutral zone, suggesting that the pair remains with trading range in the coming weeks.
The fundamental outlook discussed below makes a solid case for the EURUSD having found a floor, but offers no compelling evidence for a serious attempt to break above the 1.39 area that comprises the top of that range.
The Bullish Wildcard: Will The EURUSD Resume Tracking The Indexes?
That said, with uncertainty over bearish ECB moves over for the coming months, the pair is now once again free to resume tracking overall risk appetite as reflected by the S&P 500 and other leading US and EU indexes, as it did before the ECB’s May hints of coming easing steps in June.
