FX Traders’ weekly EURUSD fundamental & technical picture, this week’s market drivers that could change it- the bullish, the bearish and likely EURUSD direction & why it broke from its normal correlations with stocks
The following is a partial summary of the conclusions from the fxempire.com  fxempire.com ’ meeting in which we cover outlooks for the major pairs for the coming week and beyond.
Summary
-Weekly technical picture: Bullish Momentum Versus Bearish Strong Longer Term Resistance in the 1.39-1.40 level
-Fundamental Picture Is Neutral As The USD Negatives Are Now Old News
-Why the pair broke character and rallied despite stock selloff
-It’s light economic calendar for EU and US events – but a batch of major earnings reports could be the big risk appetite driver. Easter holiday may limit liquidity towards the end of the week, as will the very light Friday economic calendar
-Our sample of real time trader positioning has swung sharply to the short side as traders appear to have taken profits on long EURUSD profits last week
TECHNICAL OUTLOOK
Normally we first we look at overall risk appetite as portrayed by our sample of global indexes, because the EURUSD has been tracking these fairly well recently.
Overall Risk Appetite Per Weekly Charts Of Leading Global Stock Indexes
However the past week was an exception to that rule. While US and European stock indexes sold off, the EURUSD broke character and rallied sharply.
Therefore the overall risk-aversion the indexes displayed was irrelevant for the EURUSD, and we’ll limit our comments on it this week.
We would only warn that the pair doesn’t tend to break from its normal correlations for long. Therefore if the global selloff continues, that adds to the chances for a EURUSD pullback.
The daily charts of these indexes are near strong support. For example, the S&P 500 closed only 15 points above 1800. A confirmed break below would be negative for both equities and the EURUSD. The weekly charts show neutral longer term momentum for the indexes, which is neutral for the EURUSD as well.
EURUSD Weekly Technical Outlook
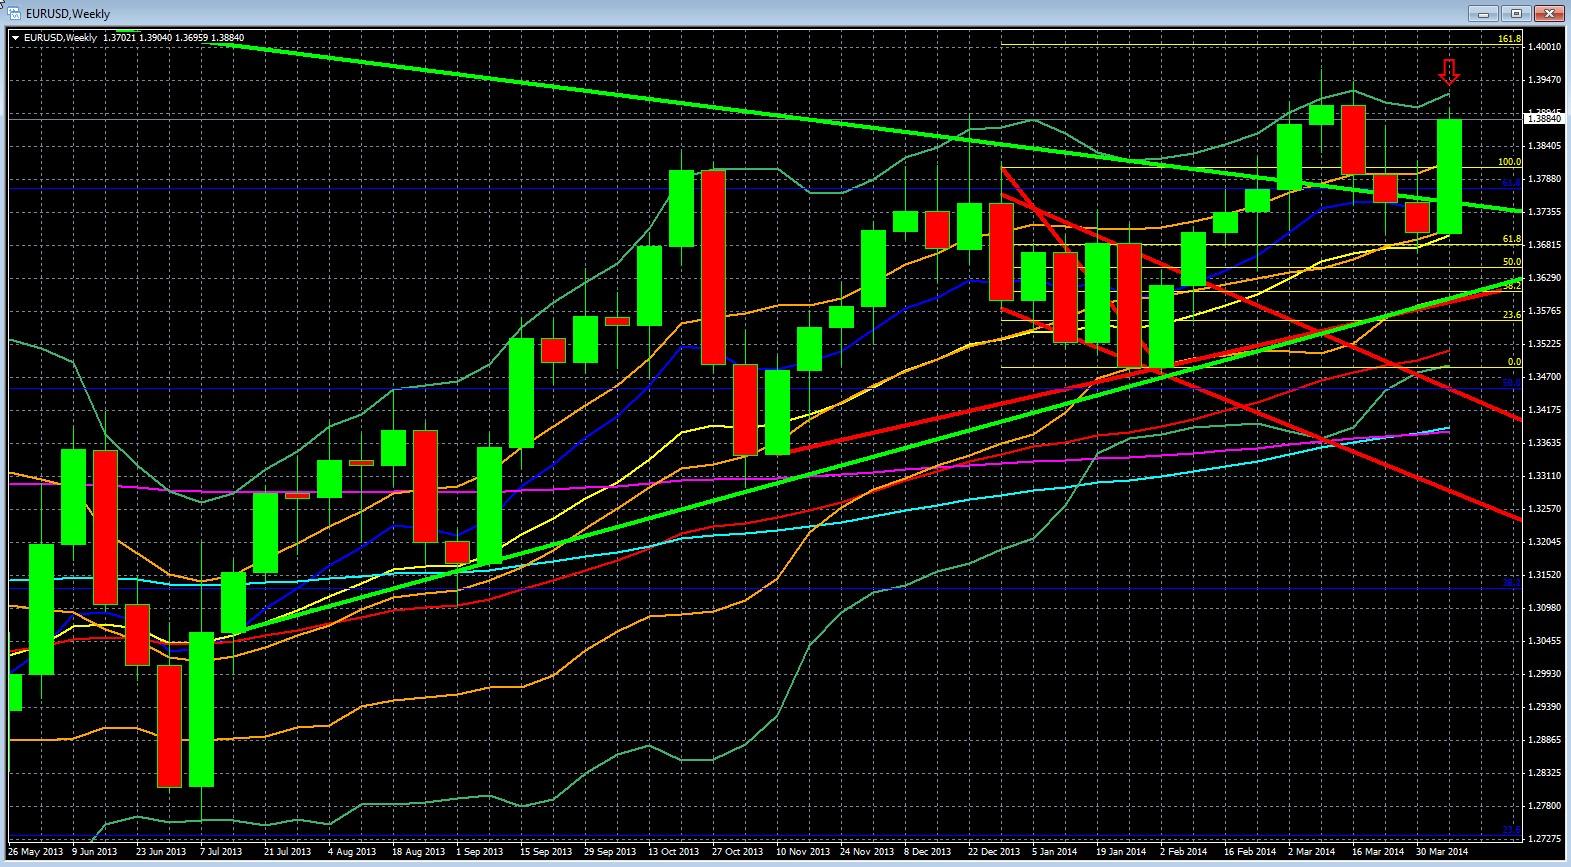
 EURUSD Weekly Chart May 26 2013 – Present: Bullish Higher Low But 1.400 Resistance Looms Near
KEY: 10 Week EMA Dark Blue, 20 WEEK EMA Yellow, 50 WEEK EMA Red, 100 WEEK EMA Light Blue, 200 WEEK EMA Violet, DOUBLE BOLLINGER BANDS: Normal 2 Standard Deviations Green, 1 Standard Deviation Orange
Source: MetaQuotes Software Corp, www.fxempire.com, www.thesensibleguidetoforex.com
01 Apr. 12 23.14
Key Take-Aways Weekly Chart:
—Bullish Momentum: The pair is back in its double Bollinger®band buy zone, longer term upward momentum returns, odds favor more upside. Of course this also hold true on the daily chart as recent gains mean shorter term momentum is even stronger by a variety of measures.
—Bearish Resistance At 1.4: The pair has failed 3 times in the past 6 months to make a sustained move over 1.39, and hasn’t been above 2011 since autumn 2011.
—Likely EURUSD range for the coming week: 1.3950 – 1.3680. We suspect a test into the 1.39 area, but we’ll need a bullish EURUSD surprise for a sustained move over 1.39. Longer term support at 1.368 looks solid given the multiple types of support (price, 61.8% Fibonacci retracement of the prior downtrend, 20 week/200 day EMA).
FUNDAMENTAL OUTLOOK: THE BALANCE OF BULLISH VS. BEARISH
The biggest fundamental question is, why the EURUSD suddenly stopped tracking the overall trends in US and European stocks, and should this behavior continue?
Bullish
The EURUSD has generally tracked the S&P 500 fairly well, yet last week that correlation broke down. Despite the global stock selloff last week, the EURUSD managed to recover nearly 3 weeks’ of losses and return to the upper end of its 5 week trading range. Why?
