FX Traders’ weekly EURUSD fundamental & technical picture, this week’s market drivers that could change it- the bullish, the bearish and likely EURUSD direction. New drama feeding old drivers
The following is a partial summary of the conclusions from the fxempire.com weekly analysts’ meeting in which we cover outlooks for the major pairs for the coming week and beyond.
Summary
- Technical Outlook: Edging towards trend topping and reversing, key levels to watch and why.
- Fundamental Outlook: New developments feeding the same drivers – EU data, Fed rate revelations, and all else matter only insofar as they influence speculation on the likelihood, extent, and type of ECB easing.
- What To Watch: Further Fed signals of low rates for longer term, elections, US GDP, etc.
- Trader Positioning: Our sample group continues to make a classic beginners mistake.
TECHNICAL OUTLOOK
This week we again minimize our usual discussion of overall risk appetite per our sample of leading global stock indexes. For the past 3 weeks they haven’t helped us forecast EURUSD moves:
- The EURUSD has ceased tracking these indexes and has been falling for the past 3 weeks as it moves with its bearish specific fundamental drivers, rather than overall risk appetite, and it is likely to continue to do so this week. See the fundamental outlook section below for specifics. Â
- Indeed, the leading US and European indexes are moving higher, as increasingly dovish looks from both the Fed and ECB benefit stocks, while the fading expectations for USD rate increases create distinct problems for the EUR, as we discuss below.
EURUSD Weekly Technical Outlook: Edging Towards Trend Topping & Reversing

EURUSD Weekly Outlook: Edging Towards A Trend Reversal-Drivers, Ramifications, How To Profit
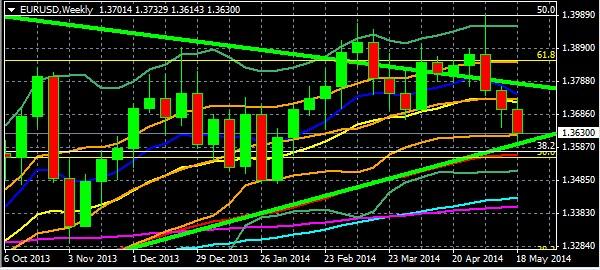
EURUSD Weekly Chart October 6, 2013 to Present
KEY: 10 Week EMA Dark Blue, 20 WEEK EMA Yellow, 50 WEEK EMA Red, 100 WEEK EMA Light Blue, 200 WEEK EMA Violet, DOUBLE BOLLINGER BANDS: Normal 2 Standard Deviations Green, 1 Standard Deviation Orange. Green downtrend line from EURUSD peak of July 2008 to present, green uptrend line from August 2012 to present.
Source: MetaQuotes Software Corp, www.fxempire.com, www.thesensibleguidetoforex.com
01 May. 24 21.2
Key Take-Aways Weekly Chart: Why EURUSD Trend Change Could Be Imminent
The 1.37 and 1.3650 support areas broke down leaving the pair to test deeper support, and to close the week at 1.3630
While the pair remains in its 15 week trading range, it’s barely hanging on at the low of that range. It remains at the lower edge if its neutral double Bollinger ® band zone. With Friday’s close below the 1.365 support level for the second straight day, that level looks broken. The next big support zone is around 1.36 -1.355, buttressed by five layers of converging support:
–The round 1.355 figure itself
–The green uptrend line dating from mid-2012
–The 50% Fibonacci retracement of the downtrend from mid-2011 to mid-2012.
–The 38.2% Fibonacci retracement of the bigger downtrend from July 2008 to June 2010
–Most importantly, the psychologically critical 50 week (aka 200 day) EMA in the 1.355 zone. For many medium and longer term traders, when something breaks below its 200 day moving average, that’s the time to exit longs and open short positions.
As we’ve said before, a confirmed close below 1.35 (we allow for some wiggle room) is our signal that the pair has topped out for now and that the uptrend dating from mid-2012 is over for now.
Actually, the odds favor more downtrend as soon as we get into the DOUBLE BOLLINGER BANDS:, which begins around 1.36. This is a key level for all forex investors, as a new EURUSD downtrend will provide potent fuel for a USD rally against its other counterparts, for reasons we’ve discussed here.
Then the only question would be whether it’s going to test deeper support around 1.345 -1.34 (where both its 100 and 200 week EMAs reside) or settle into a new flat trading range centered around the 1.355 zone.
FUNDAMENTAL OUTLOOK: THE BALANCE OF BULLISH VS. BEARISH
Summary
New events continue to reinforce the same fundamentals behind the downtrend of the past two weeks:
Speculation About A Bigger ECB Stimulus Package – Now Driven By Falling US Rates
ECB President Draghi’s hints of possible rate cuts were what started the EURUSD’s downtrend after the last ECB meeting. Ongoing speculation about the new stimulus, fed by continued poor EU economic data last week, kept that speculation thriving, and was the prime driver of the EURUSD downtrend last week. This past week we had yet another new development to expand expectations about the likelihood and extent of ECB easing.
