EURUSD Daily Pivots
| R3 | 1.1352 |
| R2 | 1.1279 |
| R1 | 1.1145 |
| Pivot | 1.1073 |
| S1 | 1.0939 |
| S2 | 1.0866 |
| S3 | 1.0732 |

EURUSD (1.0981): EURUSD is trading below the 1.1 psychological handle after consolidating near the 1.117 through 1.1135 support/resistance level. Failure to find support near 1.098 price level is likely to see EURUSD decline down to 1.082 as the last support level which could be the line in the sand before prices decline further and possibly resume its bearish trend. From the daily charts, price action closed Friday on a bearish note as well, forming a minor bearish engulfing candlestick and the price zone between 1.09 through 1.0825 forms an important support level to keep an eye on.
USDJPY Daily Pivots
| R3 | 122.722 |
| R2 | 122.165 |
| R1 | 121.844 |
| Pivot | 121.238 |
| S1 | 120.905 |
| S2 | 120.311 |
| S3 | 119.978 |

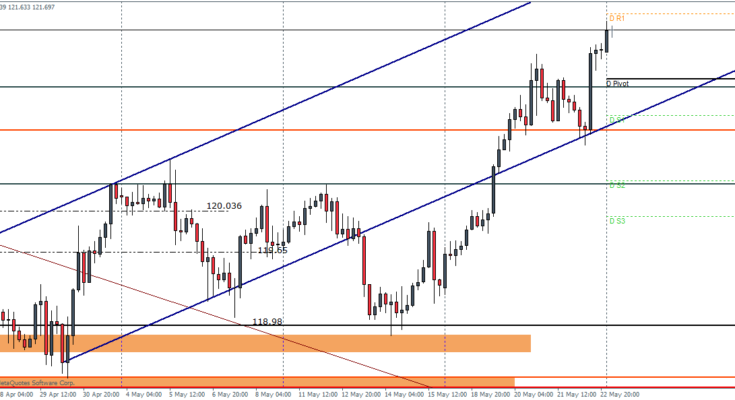
USDJPY (121.69): USDJPY formed a bullish engulfing candlestick on the daily charts and trading near 121 price level, indicating a possible continuation to the upside. A daily close above 121.5 will mark a highest close since prices began to move sideways around early March this year. Short term support comes in at 121.175, which if tested could see the pair push higher. With prices back into the rising price channel, we expect to see further upside gains in the near term.
GBPUSD Daily Pivots
| R3 | 1.5854 |
| R2 | 1.5772 |
| R1 | 1.5624 |
| Pivot | 1.5542 |
| S1 | 1.5394 |
| S2 | 1.5312 |
| S3 | 1.5167 |
GBPUSD (1.5475): GBPUSD saw a strong bearish reversal candlestick pattern on Friday and closed below 1.552 support level from the daily charts, indicating a potential decline to 1.5325 where the next support level comes in. On the intraday charts, price is still between 1.551 and 1.545 support level, but with price breaking out of the price channel, we could expect to see possible declines to the next support at 1.52.

In our latest podcast, we discuss commodity currencies, oil hedging and preview next week’s events.
Subscribe to Market Movers on iTunes


