EURUSD Daily Pivots
| R3 | 1.1425 |
| R2 | 1.136 |
| R1 | 1.1321 |
| Pivot | 1.1254 |
| S1 | 1.1216 |
| S2 | 1.1149 |
| S3 | 1.111 |

EURUSD (1.128): EURUSD closed on a bullish note yesterday despite a weak opening. Prices are back to trading near 1.12845 level of resistance on the daily chart and could pose a risk of a rally higher.
On the intraday charts, price has been forming quite a few bullish candlesticks and re-adjusting the rising price channel, we now notice that there is a possibility of another rally towards the next resistance at 1.1335 region. A break above 1.1335 – 1.3575 is needed in order to target 1.149. But if the resistance holds, EURUSD could look towards another decline back to the support at 1.117.
USDJPY Daily Pivots
| R3 | 124.191 |
| R2 | 123.915 |
| R1 | 123.666 |
| Pivot | 123.391 |
| S1 | 123.142 |
| S2 | 122.88 |
| S3 | 122.617 |

USDJPY (123.57): USDJPY was moving in a tight range yesterday and it still below the previously broken support at 124. A test of this level is very much a possibility. If 124 turns to resistance, USDJPY could see a dip to 121.92 – 122 level of support. On the other hand, if prices break above 124, USDJPY could set the course for posting fresh highs.
Plotting a falling price channel, we notice price having broken out from the minor channel but the resistance at 124 needs to be cleared.
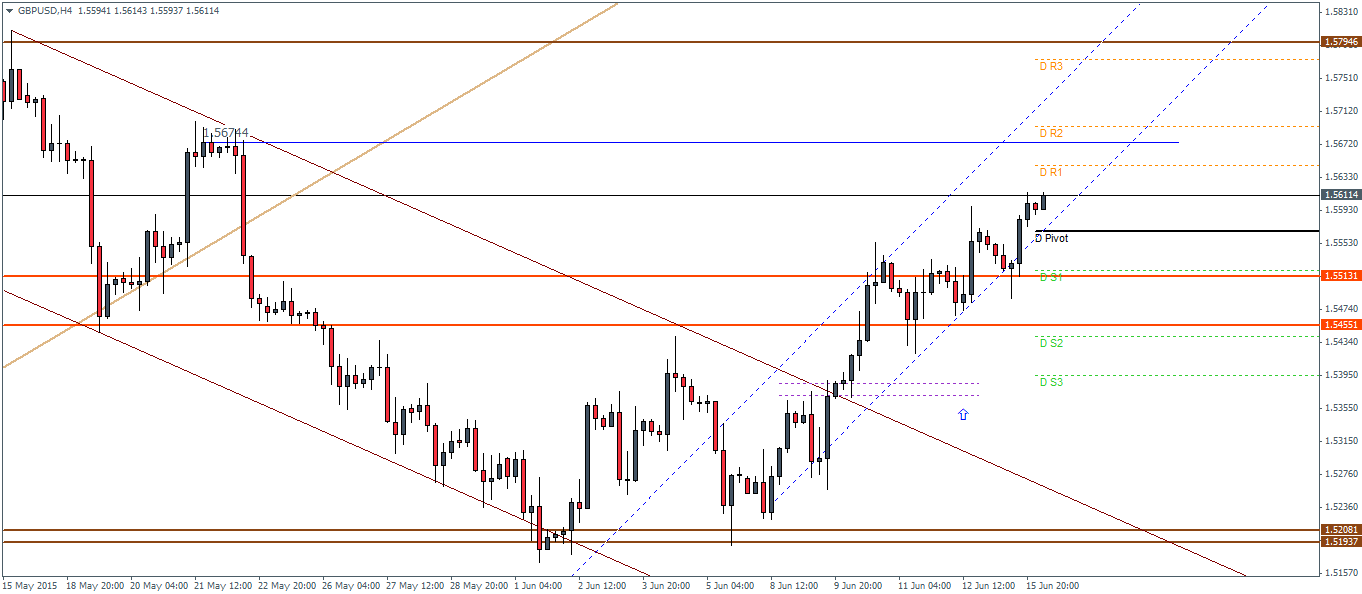
GBPUSD Daily Pivots
| R3 | 1.5773 |
| R2 | 1.5693 |
| R1 | 1.5646 |
| Pivot | 1.5567 |
| S1 | 1.5520 |
| S2 | 1.5441 |
| S3 | 1.5394 |

GBPUSD (1.5611): GBPUSD closed on a bullish note yesterday and managed to clear the resistance at 1.552, which now makes way for a test to previous highs near 1.57525.
On the intraday charts, plotting a new rising price channel shows the previously broken resistance at 1.5513 which could now act as support on any declines. To the upside, the short term resistance comes at 1.5674 which marks the start of the previous decline lower. Prices could very well react to this short term resistance for a while before the eventual rally to 1.5795.


