EURUSD Daily Pivots
| R3 | 1.1426 |
| R2 | 1.1351 |
| R1 | 1.1282 |
| Pivot | 1.1207 |
| S1 | 1.1136 |
| S2 | 1.1062 |
| S3 | 1.0992 |
 
EURUSD has formed a bullish engulfing on the open/close on the daily charts and could potentially eye some gains today on break of the major support/resistance at 1.12845. On the intraday charts, price action failed to break above 1.12547 but looks close to a break above this level today. The next resistance to target will be 1.13575 on a move higher. To the downside, 1.11705 is the support level that could pave way for declines on a close lower. The fact that price has so far held above 1.11705 indicates the bullish flag pattern could likely be in play and above 1.13575; the next target is at 1.149.
USDJPY Daily Pivots
| R3 | 120.656 |
| R2 | 120.466 |
| R1 | 120.165 |
| Pivot | 119.975 |
| S1 | 119.678 |
| S2 | 119.488 |
| S3 | 119.188 |

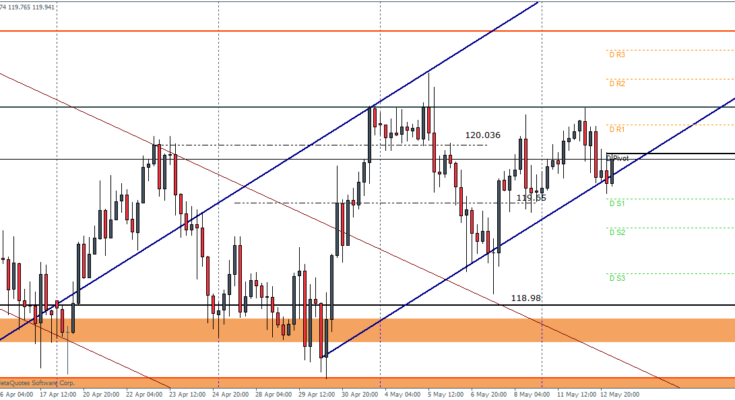
USDJPY briefly tested the lower trend line of the rising price channel but is trading within the range of 120.036 and 119.65. A break out above or below this range is needed to see further gains or declines in USDJPY. To the upside, a break above 120.28 will see USDJPY aim for 120.78, while to the downside, a break out from the rising price channel followed by 119.65 will set the stage for a decline towards 118.98 support level.
GBPUSD Daily Pivots
| R3 | 1.5885 |
| R2 | 1.5798 |
| R1 | 1.5733 |
| Pivot | 1.5643 |
| S1 | 1.558 |
| S2 | 1.549 |
| S3 | 1.5428 |

GBPUSD continues to look very bullish on the daily charts and is close to testing the next resistance level at 1.57525. Support comes in at 1.55198, which comes within the levels plotted on the intraday chart at 1.5513 through 1.5455. If support holds, GBPUSD could potentially aim for gains. A break below 1.5455 will however pose a serious downside risk to GBPUSD towards 1.495 levels.


