EURUSD Daily Pivots
| R3 | 1.1602 |
| R2 | 1.1492 |
| R1 | 1.1421 |
| Pivot | 1.1311 |
| S1 | 1.1242 |
| S2 | 1.113 |
| S3 | 1.061 |
 
EURUSD saw a bullish day yesterday as noted in yesterday’s analysis, identified by the bullish engulfing candlestick on the daily chart. Price action has managed to close above 1.12845 and made a high near 1.13819. Failure to break above previous high of 1.13909 could see EURUSD dip lower today to find support near 1.12845. On the intraday charts, price action is right near 1.13575, which marks the previous higher close. The daily pivot comes in at 1.13135 and we expect a dip to this level before prices can resume higher. A break below the daily pivot could however pose some downside risks back towards 1.11705.
USDJPY Daily Pivots
| R3 | 120.695 |
| R2 | 120.339 |
| R1 | 119.745 |
| Pivot | 119.389 |
| S1 | 118.796 |
| S2 | 118.44 |
| S3 | 117.846 |

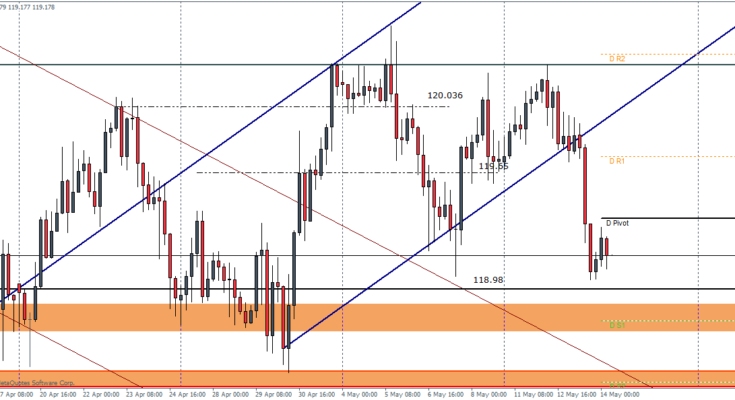
USDJPY turned lower yesterday following up with a bearish candlestick after the previous day saw a sort of dark cloud cover candlestick pattern being formed. On the intraday charts, price broke through the rising price channel and is now trading close to 118.98. We expect this level to be tested sooner than later and the price zone below 118.98 is riddled with a lot of support zones and we expect price action to slow down at the very least. A break below 118.8 will see a test to 118.5 in the near term.
GBPUSD Daily Pivots
| R3 | 1.5932 |
| R2 | 1.5849 |
| R1 | 1.5796 |
| Pivot | 1.5715 |
| S1 | 1.566 |
| S2 | 1.5579 |
| S3 | 1.5527 |

GBPUSD continues to remain very bullish as price action is now threatening the 1.57525 support/resistance level. A break above this level will see 1.59 as the next target zone. On the intraday charts, price action continues to trade comfortably within the rising price channel but the support zone at 1.5513 remains exposed and we expect any short term weakness could see the GBPUSD drop to this support level.


