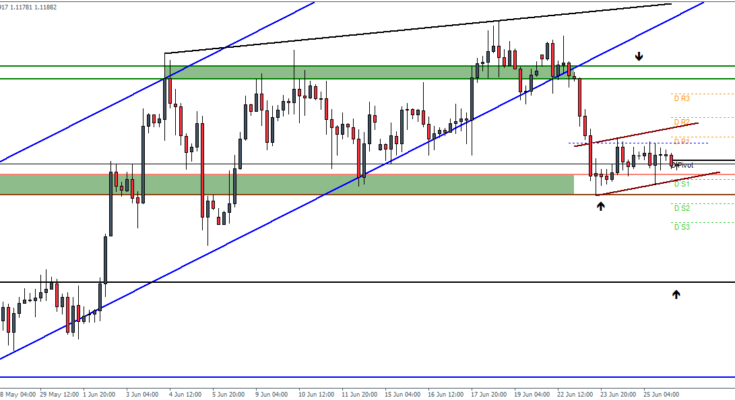
EURUSD Daily Pivots
| R3 | 1.1308 |
| R2 | 1.1268 |
| R1 | 1.1234 |
| Pivot | 1.1193 |
| S1 | 1.1161 |
| S2 | 1.1119 |
| S3 | 1.1086 |

EURUSD (1.118): EURUSD closed with a doji candlestick on the daily charts yesterday while consolidating for the most part after the decline earlier in the week. Price is still trading above the support/resistance level of 1.117 – 1.1135. A bear flag pattern is currently taking shape and we need to see a break below 1.1135 in order for the declines to continue. We look for the bearish decline to test the price level of 1.0985 on break below 1.1135. To the upside a close above 1.12245 would invalidate the flag pattern and we could see a rally back to 1.1335.
USDJPY Daily Pivots
| R3 | 124.583 |
| R2 | 124.272 |
| R1 | 123.946 |
| Pivot | 123.634 |
| S1 | 123.316 |
| S2 | 122.997 |
| S3 | 122.678 |

USDJPY (123.43): USDJPY closed on a bearish note yesterday confirming the shooting star pattern. We expect the rally noticed in USDJPY previously is likely to pause for a correction to the downside. On the intraday charts, price action has hit resistance at 124 and we could see a dip down to 122.66 support which previously formed a double bottom pattern. A break below 122.66 could see a decline towards 122 – 121.921 level of support.
GBPUSD Daily Pivots
| R3 | 1.5878 |
| R2 | 1.5824 |
| R1 | 1.5786 |
| Pivot | 1.5731 |
| S1 | 1.5693 |
| S2 | 1.5637 |
| S3 | 1.5598 |

GBPUSD (1.574): GBPUSD closed on a bullish note after seeing three days of decline. Price action is still below the previous resistance level at 1.57525. However, it is likely that the resistance could cap the gains. To the downside the next support comes in at 1.5513 level of support. For this view to the confirmed, GBPUSD will need to break below previous low of 1.568.
In our latest podcast, we discuss building on the US recovery, the Greek crisis and EUR, Saudi solar and next week’s events.
Follow us on Sticher.


