EURUSD Daily Pivots
| R3 | 1.117 |
| R2 | 1.1127 |
| R1 | 1.1054 |
| Pivot | 1.1010 |
| S1 | 1.0937 |
| S2 | 1.0893 |
| S3 | 1.082 |
Â

EURUSD (1.097): EURUSD posted a second straight day of losses as the currency failed to hold on to the gains near 1.1086. EURUSD was down trading back near the 1.097 region which marks a strong level of support. If the declines are capped here, EURUSD could see another attempt to rally but will need to clear the 1.10 level of support/resistance before attempting to test the next resistance zone at 1.117 through 1.1135. To the downside, a break below 1.09275 will see EURUSD easily fall lower to test the previous lows at 1.08206.
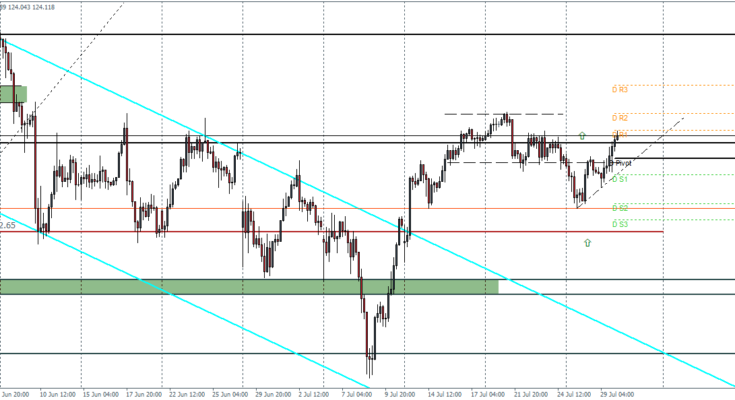
USDJPY Daily Pivots
| R3 | 124.882 |
| R2 | 124.445 |
| R1 | 124.192 |
| Pivot | 123.765 |
| S1 | 123.504 |
| S2 | 123.077 |
| S3 | 122.826 |

USDJPY (124.1): USDJPY is posting a breakout candle after forming an inside bar three days ago. However for this to be successful, USDJPY will need to break above the previous highs at 124.285 in order to target the upper resistance at 125.432. Alternatively, failure to break higher could see USDJPY fail at 124 and could see the currency fall back to test the previous support at 122.65.
GBPUSD Daily Pivots
| R3 | 1.5767 |
| R2 | 1.5727 |
| R1 | 1.5664 |
| Pivot | 1.5625 |
| S1 | 1.5562 |
| S2 | 1.5524 |
| S3 | 1.5461 |

GBPUSD (1.559): GBPUSD printed a bearish pinbar candlestick pattern on the daily chart after briefly testing the highs of 1.569, marking a fourth attempt to break this level but failing to do so. Price action needs to head back into the falling price channel or a bounce off the trend line could see GBPUSD possibly break above 1.569 region. To the downside, the declines are likely to be limited near the support zone of 1.551 through 1.5455.


