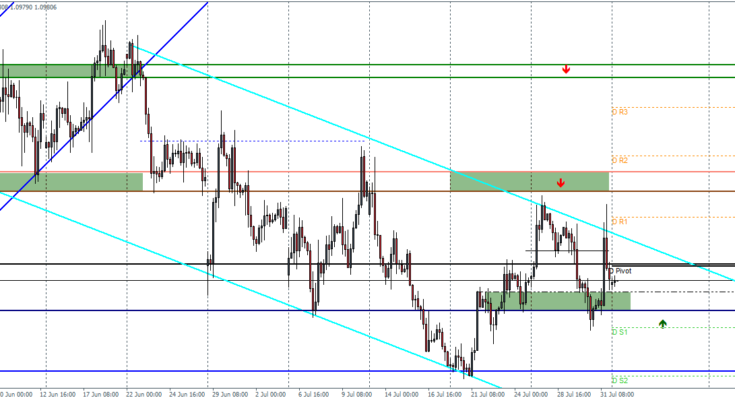
EURUSD Daily Pivots
| R3 | 1.1283 |
| R2 | 1.1197 |
| R1 | 1.1089 |
| Pivot | 1.1005 |
| S1 | 1.0897 |
| S2 | 1.0811 |
| S3 | 1.0703 |
Â

EURUSD (1.097): EURUSD closed last week with a doji which comes after a previous bullish session. On the daily charts, price action closed just below 1.0975 level of support/resistance and we need to see further confirmation for the upside bias to be built, failing which EURUSD could potentially fall further. On the intraday charts, we have re-adjusted the falling price channel and notice that support comes in at a1.0925 region. We could expect some consolidation on this level before anticipating a decline back to 1.082. Alternatively, if EURUSD breaks the price channel, 1.10 will be the level to retest ahead of rallying to 1.1135.
USDJPY Daily Pivots
| R3 | 125.186 |
| R2 | 124.775 |
| R1 | 124.334 |
| Pivot | 123.923 |
| S1 | 123.472 |
| S2 | 123.072 |
| S3 | 122.62 |

USDJPY (124): USDJPY has posted two straight weeks of forming a doji candlestick pointing to a very indecisive bias. Price is still seen consolidating near the 124 region and we could expect this to continue for a while. To the upside, a break above 124.43 is needed to aim for 125.6 while to the downside the break of the re-adjusted minor trend line could see a test back to 123 region of support through 122.65.
GBPUSD Daily Pivots
| R3 | 1.5812 |
| R2 | 1.5745 |
| R1 | 1.5682 |
| Pivot | 1.5615 |
| S1 | 1.5553 |
| S2 | 1.5486 |
| S3 | 1.5425 |

GBPUSD (1.56): GBPUSD has made quite a few attempts to break the resistance at 1.565 and looks to have formed a double top. If this pattern is validated, GBPUSD could see a quick decline down to 1.55165 which marks the measured move of the double top pattern and also forms the major support level that we have noted. On the daily charts, price has been moving sideways but there is a potential ascending triangle pattern being formed with resistance at 1.567. If the lower time frame double top pattern is validated, GBPUSD could see a decline to 1.5516 which could then give way for a test to 1.5324.


