- EUR/USD has recovered as US yields dropped off the highs.
- America’s vaccination advantage, upcoming stimulus and bond auctions all point to fresh EUR/USD falls.
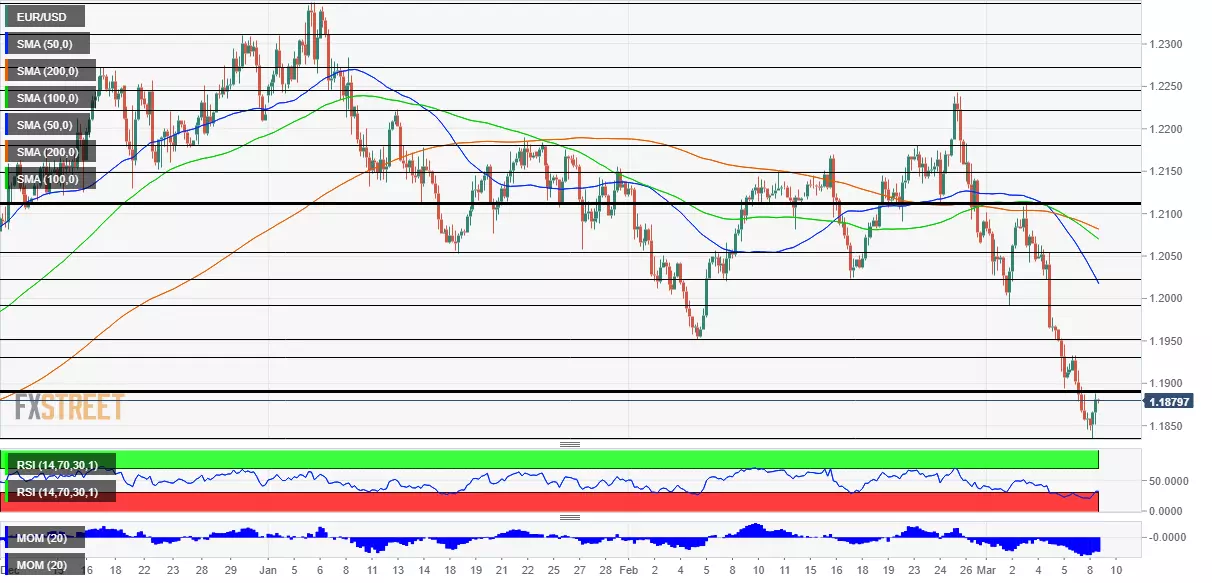
- Tuesday’s four-hour chart is showing the pair has exited oversold conditions.
Yet another dead-cat bounce? The pattern of a small rise from the bottom only to take another dive is typical to EUR/USD – and it seems to be on the verge of repetition. Markets have somewhat calmed down on Tuesday after a turbulent start to the week. Authorities in China have intervened to lift tech stocks from the lows, and the switch to a positive mood is weighing on the safe-haven dollar.
Another downer for the greenback is the retreat of ten-year yields from their highs above 1.60%. The drop in returns on Treasuries may be related to Treasury Secretary Janet Yellen’s assertion that the US has tools to deal with inflation. The former Chair of the Federal Reserve carries weight also when talking about monetary topics.
Nevertheless, Congress is on the verge of approving President Joe Biden’s massive $1.9 trillion coronavirus relief package, and the mere need to issue more debt is set to raise yields and the dollar. A bond auction due on Wednesday is highly anticipated.
In the old continent, updated growth figures for the fourth quarter will likely confirm the contraction of 0.6% previously reported. Prospect is not much better. European countries have vaccinated roughly 8% of their populations while the US is at 18% and accelerating. Italy’s fresh COVID-19 wave is of specific worry.
Will the European Central Bank help out? The Frankfurt-based institution is capable of boosting the eurozone economies but seems unwilling or unable to ramp up support. The latest weekly bond-buying figures have shown a slowdown rather than a pick-up in support.
ECB Preview: Three scenarios for Lagarde to loosen policy, not necessarily lower the euro
All in all, the recent breather in US yield advances and EUR/USD falls looks temporary.
EUR/USD Technical Analysis

Euro/dollar is trading below the 50, 100 and 200 Simple Moving Averages on the four-hour chart and suffers from downside momentum. Moreover, the recent bounce has sent the Relative Strength Index above 30 – exiting oversold conditions and allowing for more falls.
Support awaits at the new 2021 trough of 1.1836, followed by 1.1775 and 1.1730.
Resistance awaits at 1.1888, the daily high and roughly last week’s low – a separator of ranges. It is followed by 1.1930 and 1.1950.


